Mundane plotting made easy.


plotez is a Python library that simplifies common matplotlib plotting tasks with an intuitive API. Create complex plots
with minimal boilerplate code.
- Simple API: Create complex plots with just a few lines of code
- Error Bar Plotting: Comprehensive error bar support with enhanced styling options
- Error Band Plotting: Shaded error band support via
plot_errorbandandErrorBandConfig - Dual-Axis Support: Easy creation of dual y-axis or dual x-axis plots
- Multi-Panel Layouts: Flexible subplot arrangements with automatic labeling
- File Integration: Direct plotting from CSV files
- Extensive Customization: Full control over plot appearance via parameter classes
- Custom Exceptions: Domain-specific exceptions for clear, catchable error handling
- Type Safety: Complete type hints for better IDE support and type checking (PEP 561 compliant)
- Well Tested: Comprehensive test suite with 80%+ coverage
pip install plotezgit clone https://github.com/syedalimohsinbukhari/plotez.git
cd plotez
pip install -e .pip install -e ".[dev]"import numpy as np
from plotez import plot_xy
x = np.linspace(0, 10, 100)
y = np.sin(x)
plot_xy(x, y, auto_label=True)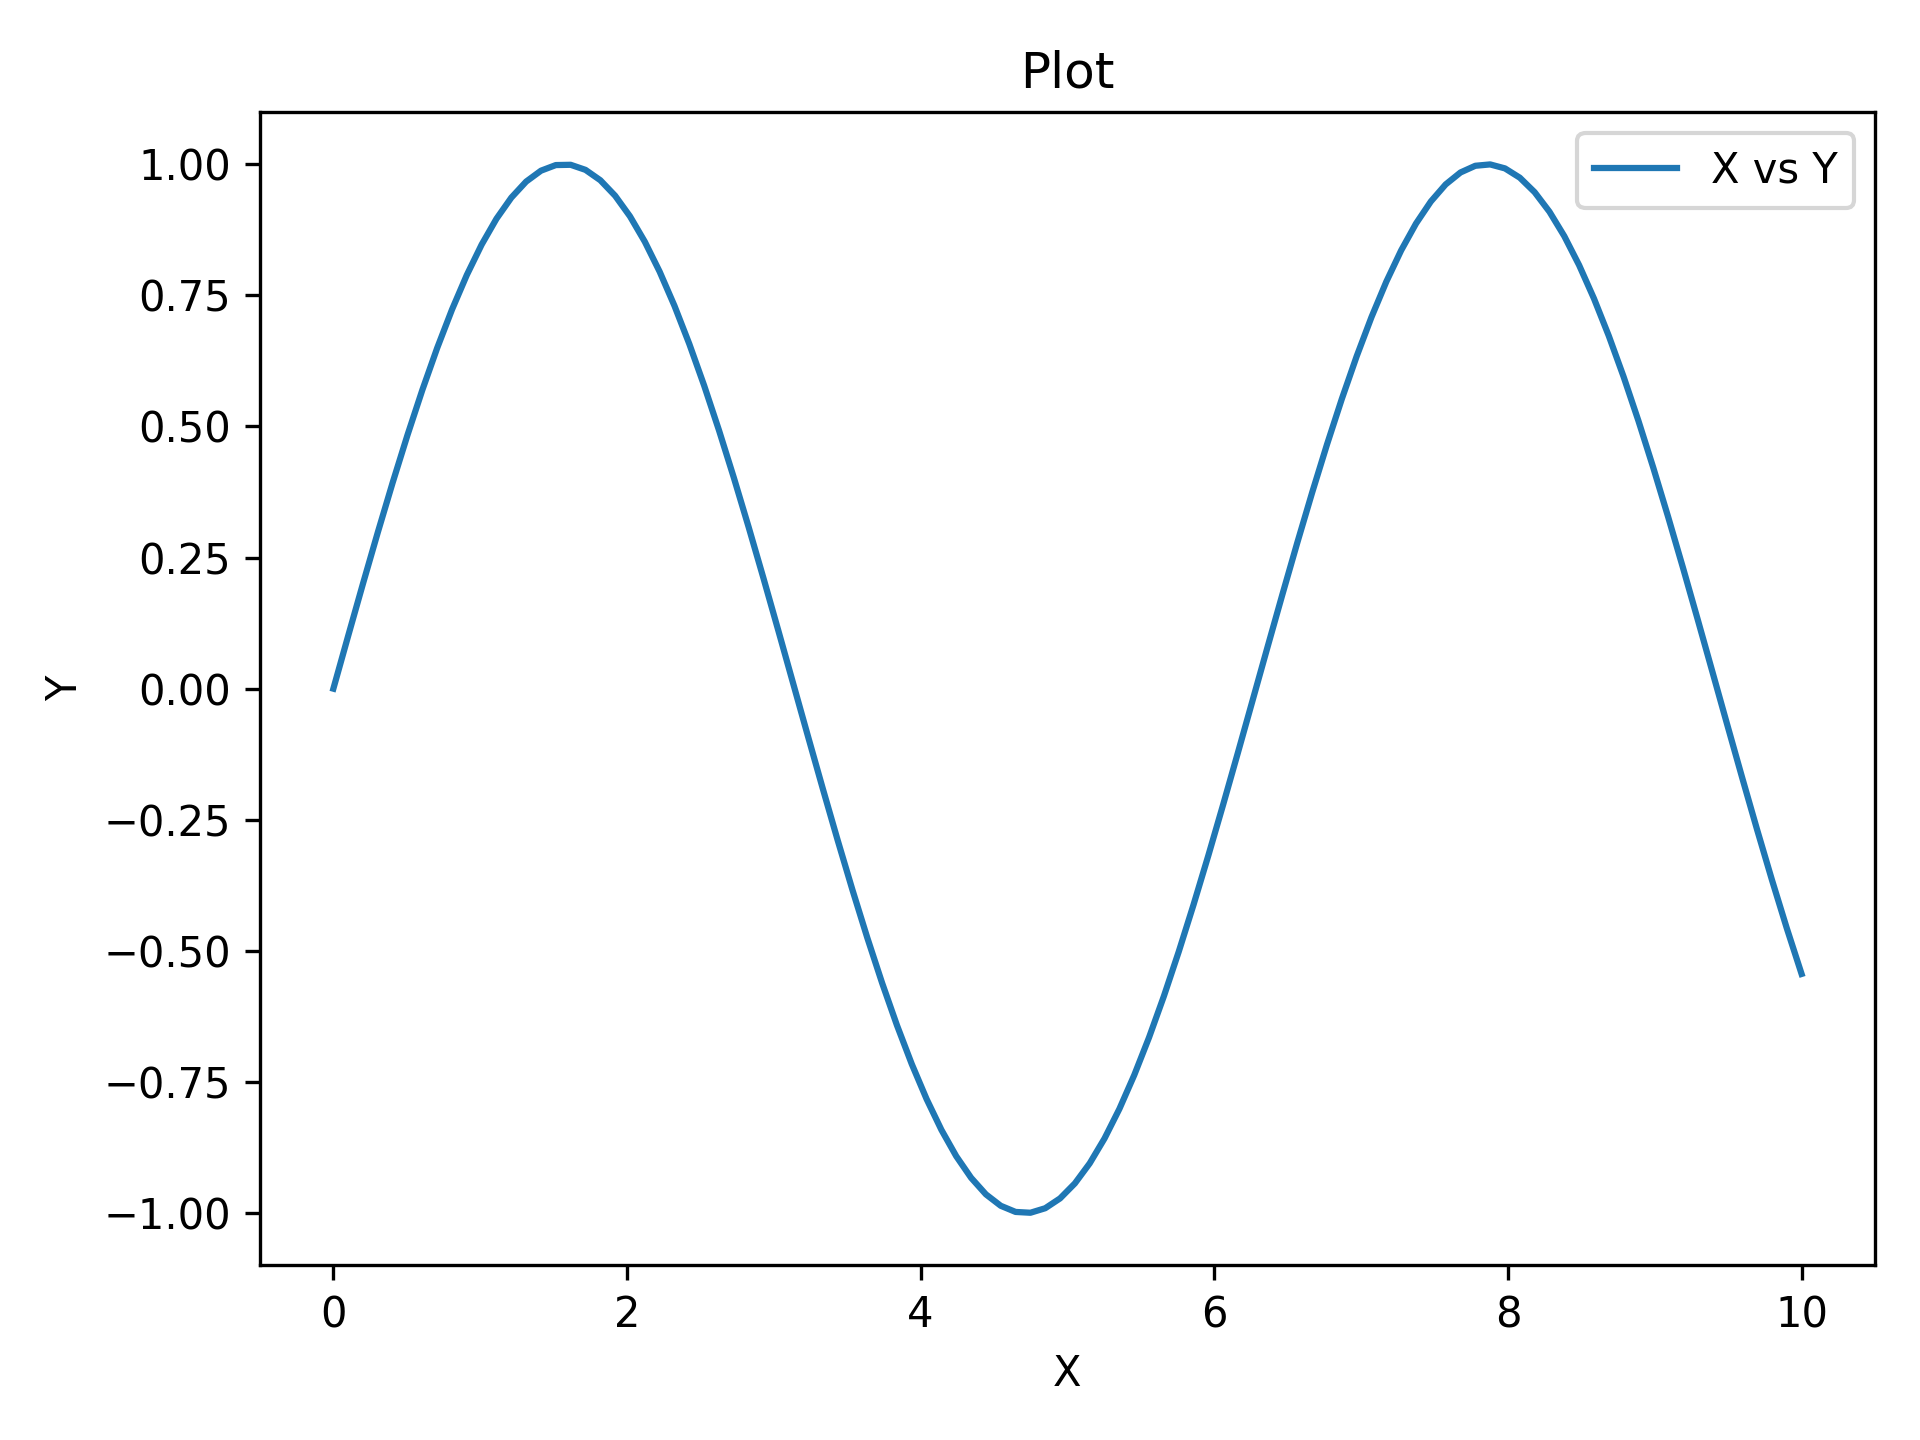
That's it. Three lines for a labeled plot.
import numpy as np
from plotez import plot_errorbar
from plotez.backend import ErrorPlotConfig

rng = np.random.default_rng(1234)

x = np.linspace(0, 10, 20)
y = np.sin(x)
y_err = 0.2 * rng.random(size=y.shape)

ep = ErrorPlotConfig(color="darkblue", marker="o", capsize=5, ecolor="red", markerfacecolor="lime")
plot_errorbar(x, y, y_err=y_err, errorbar_config=ep, auto_label=True)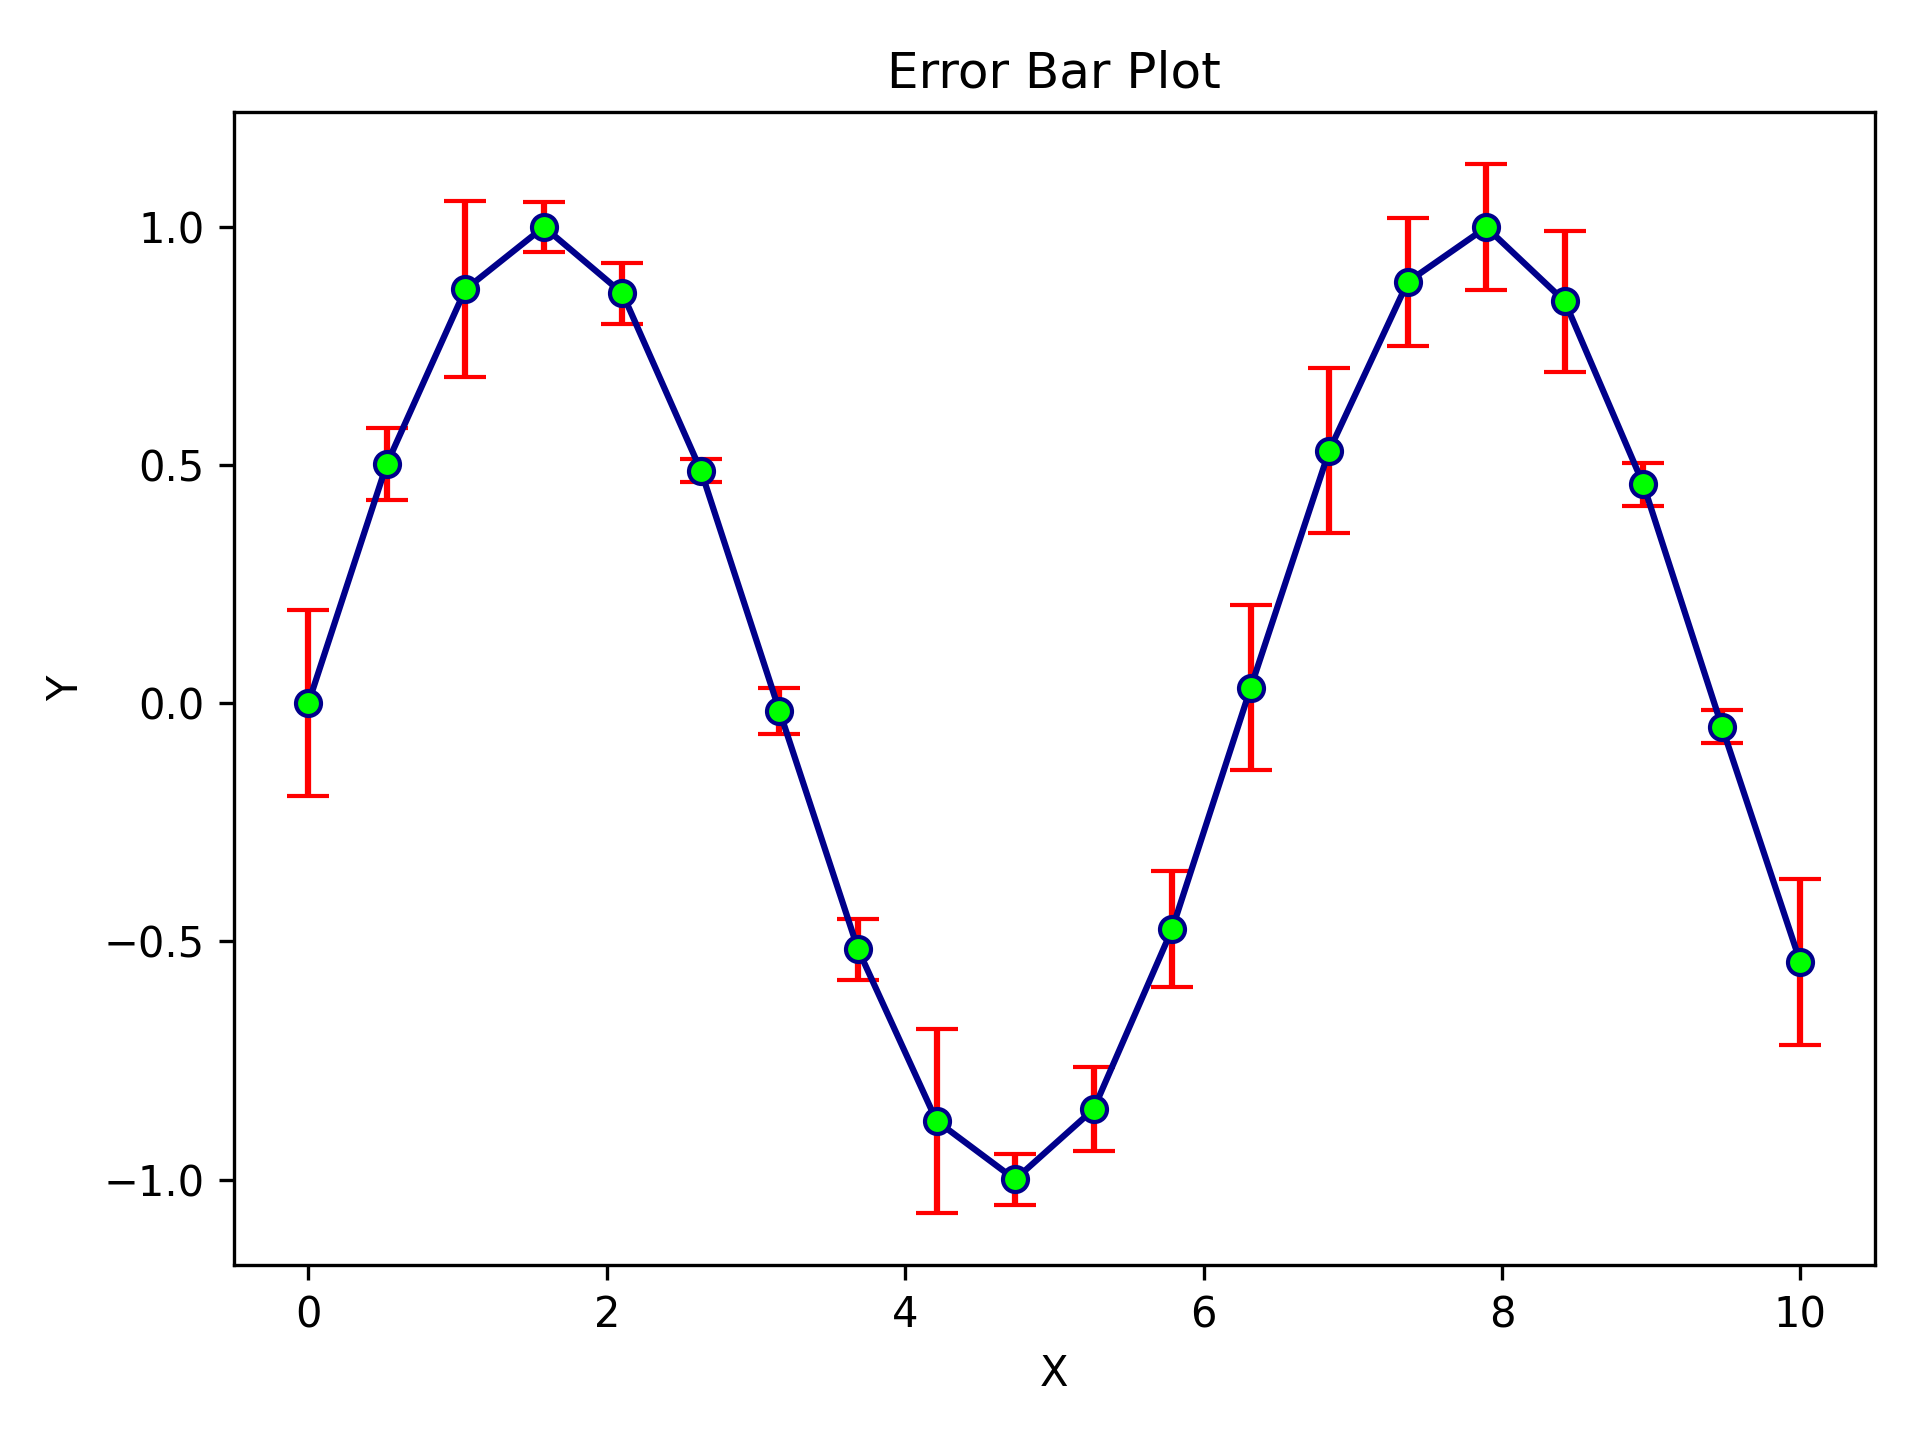
Professional error bars in a few lines of config. ecolor sets the error bar colour independently from the line colour.
import numpy as np
from plotez import plot_xyy

x = np.linspace(0, 10, 100)
y1 = np.sin(x)
y2 = np.exp(-x / 10)

plot_xyy(x, y1, y2,
         x_label="Time (s)", y1_label="Signal (V)", y2_label="Decay",
         data_labels=["Oscillation", "Envelope"])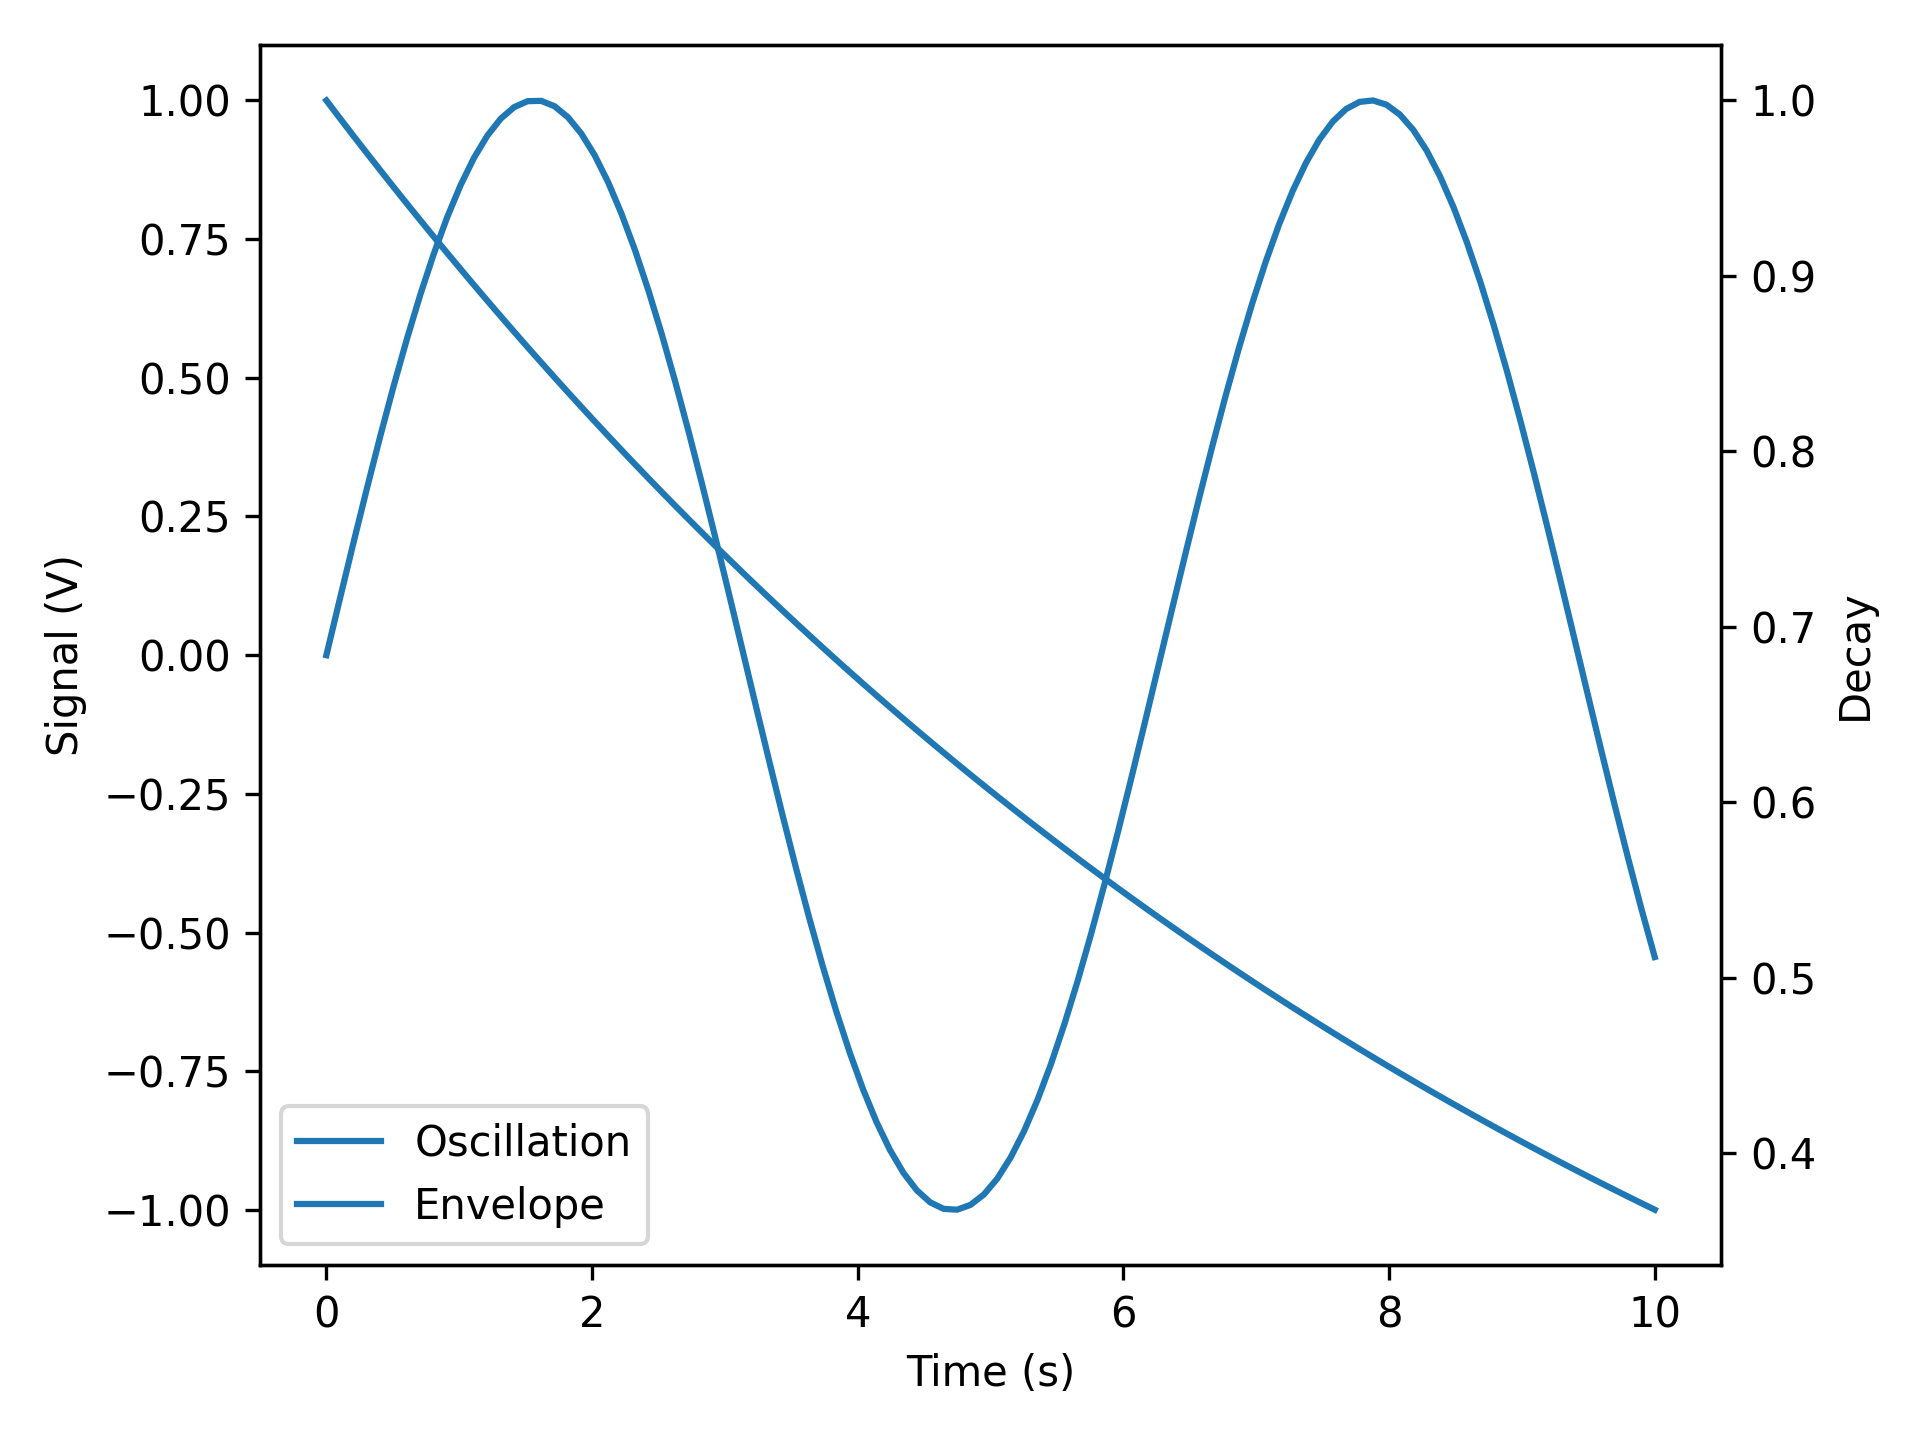
Dual axes done right. No ax.twinx() gymnastics.
import numpy as np
from plotez import n_plotter

x_data = [np.linspace(0, 10, 100) for _ in range(4)]
y_data = [np.sin(x_data[0]), np.cos(x_data[1]),
          np.tan(x_data[2] / 5), x_data[3] ** 2 / 100]

n_plotter(x_data, y_data, n_rows=2, n_cols=2, auto_label=True)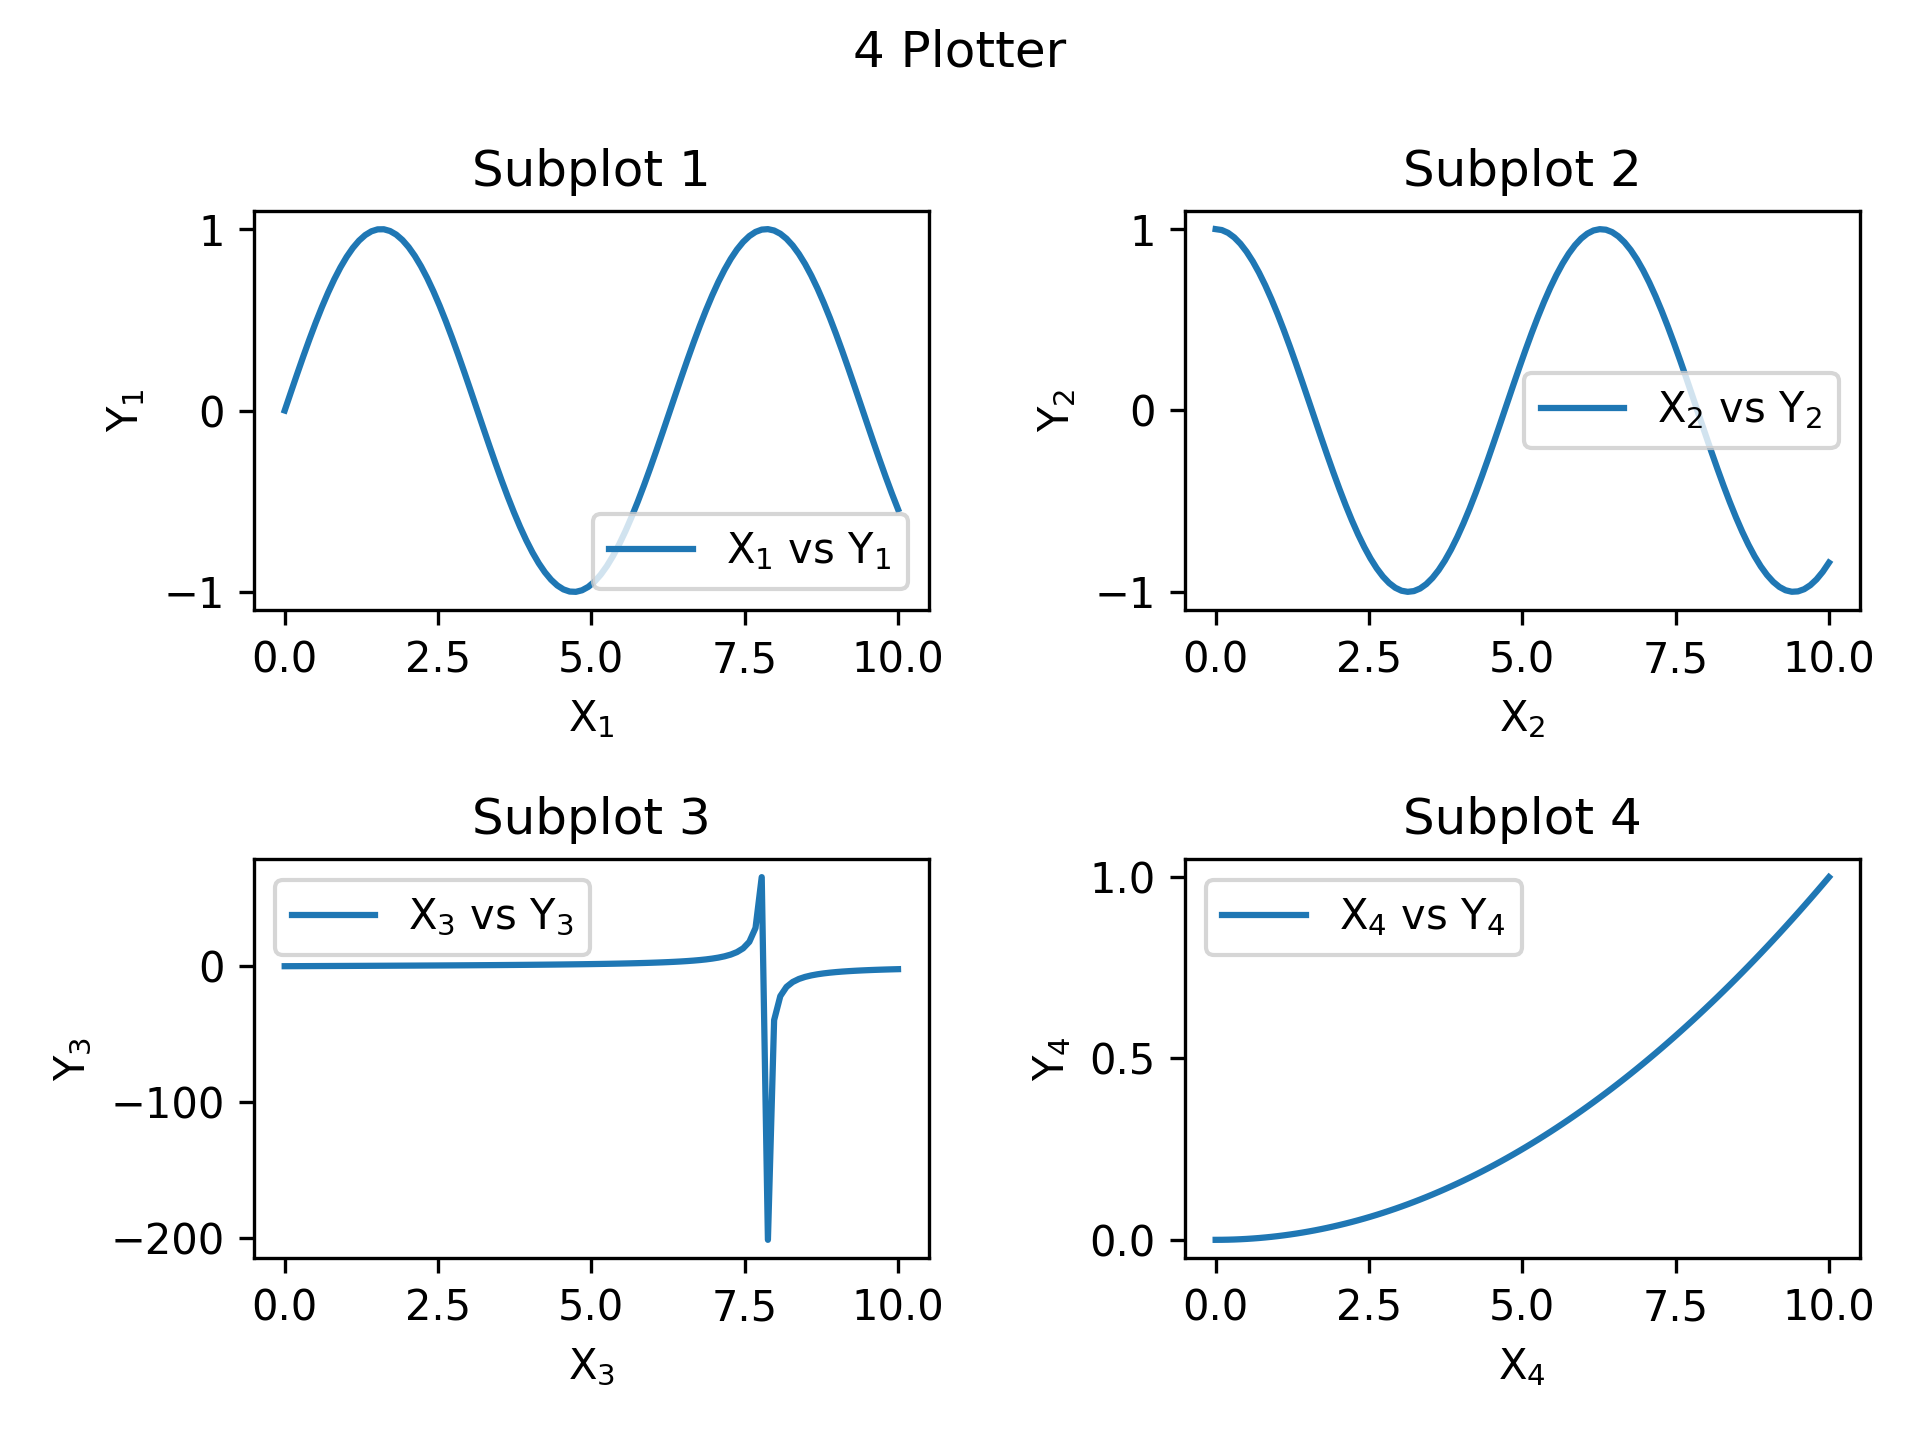
Four plots, one function call.
Use ErrorBandConfig and LinePlotConfig for explicit, IDE-friendly configuration:
import numpy as np
from plotez import plot_errorband
from plotez.backend import ErrorBandConfig, LinePlotConfig

x = np.linspace(0, 10, 50)
y = np.sin(x)
y_lower = y - 0.2
y_upper = y + 0.2

band_config = ErrorBandConfig(color="darkblue", alpha=0.25)
plot_config = LinePlotConfig(color="gold", linewidth=2, linestyle="--",
                             marker="o", markersize=5, markeredgecolor="k")

plot_errorband(x, y, y_lower, y_upper,
               data_label="Measurement", band_config=band_config, line_config=plot_config)
The same result using the ebc / lpc shorthand aliases — familiar matplotlib parameter names, no class imports needed:
import numpy as np
from plotez import ebc, lpc, plot_errorband

x = np.linspace(0, 10, 50)
y = np.sin(x)
y_lower = y - 0.2
y_upper = y + 0.2

band_config = ebc(c="darkblue", alpha=0.25)
plot_config = lpc(c="gold", lw=2, ls="--", marker="o", ms=5, mec="k")

plot_errorband(x, y, y_lower, y_upper,
               data_label="Measurement", band_config=band_config, line_config=plot_config)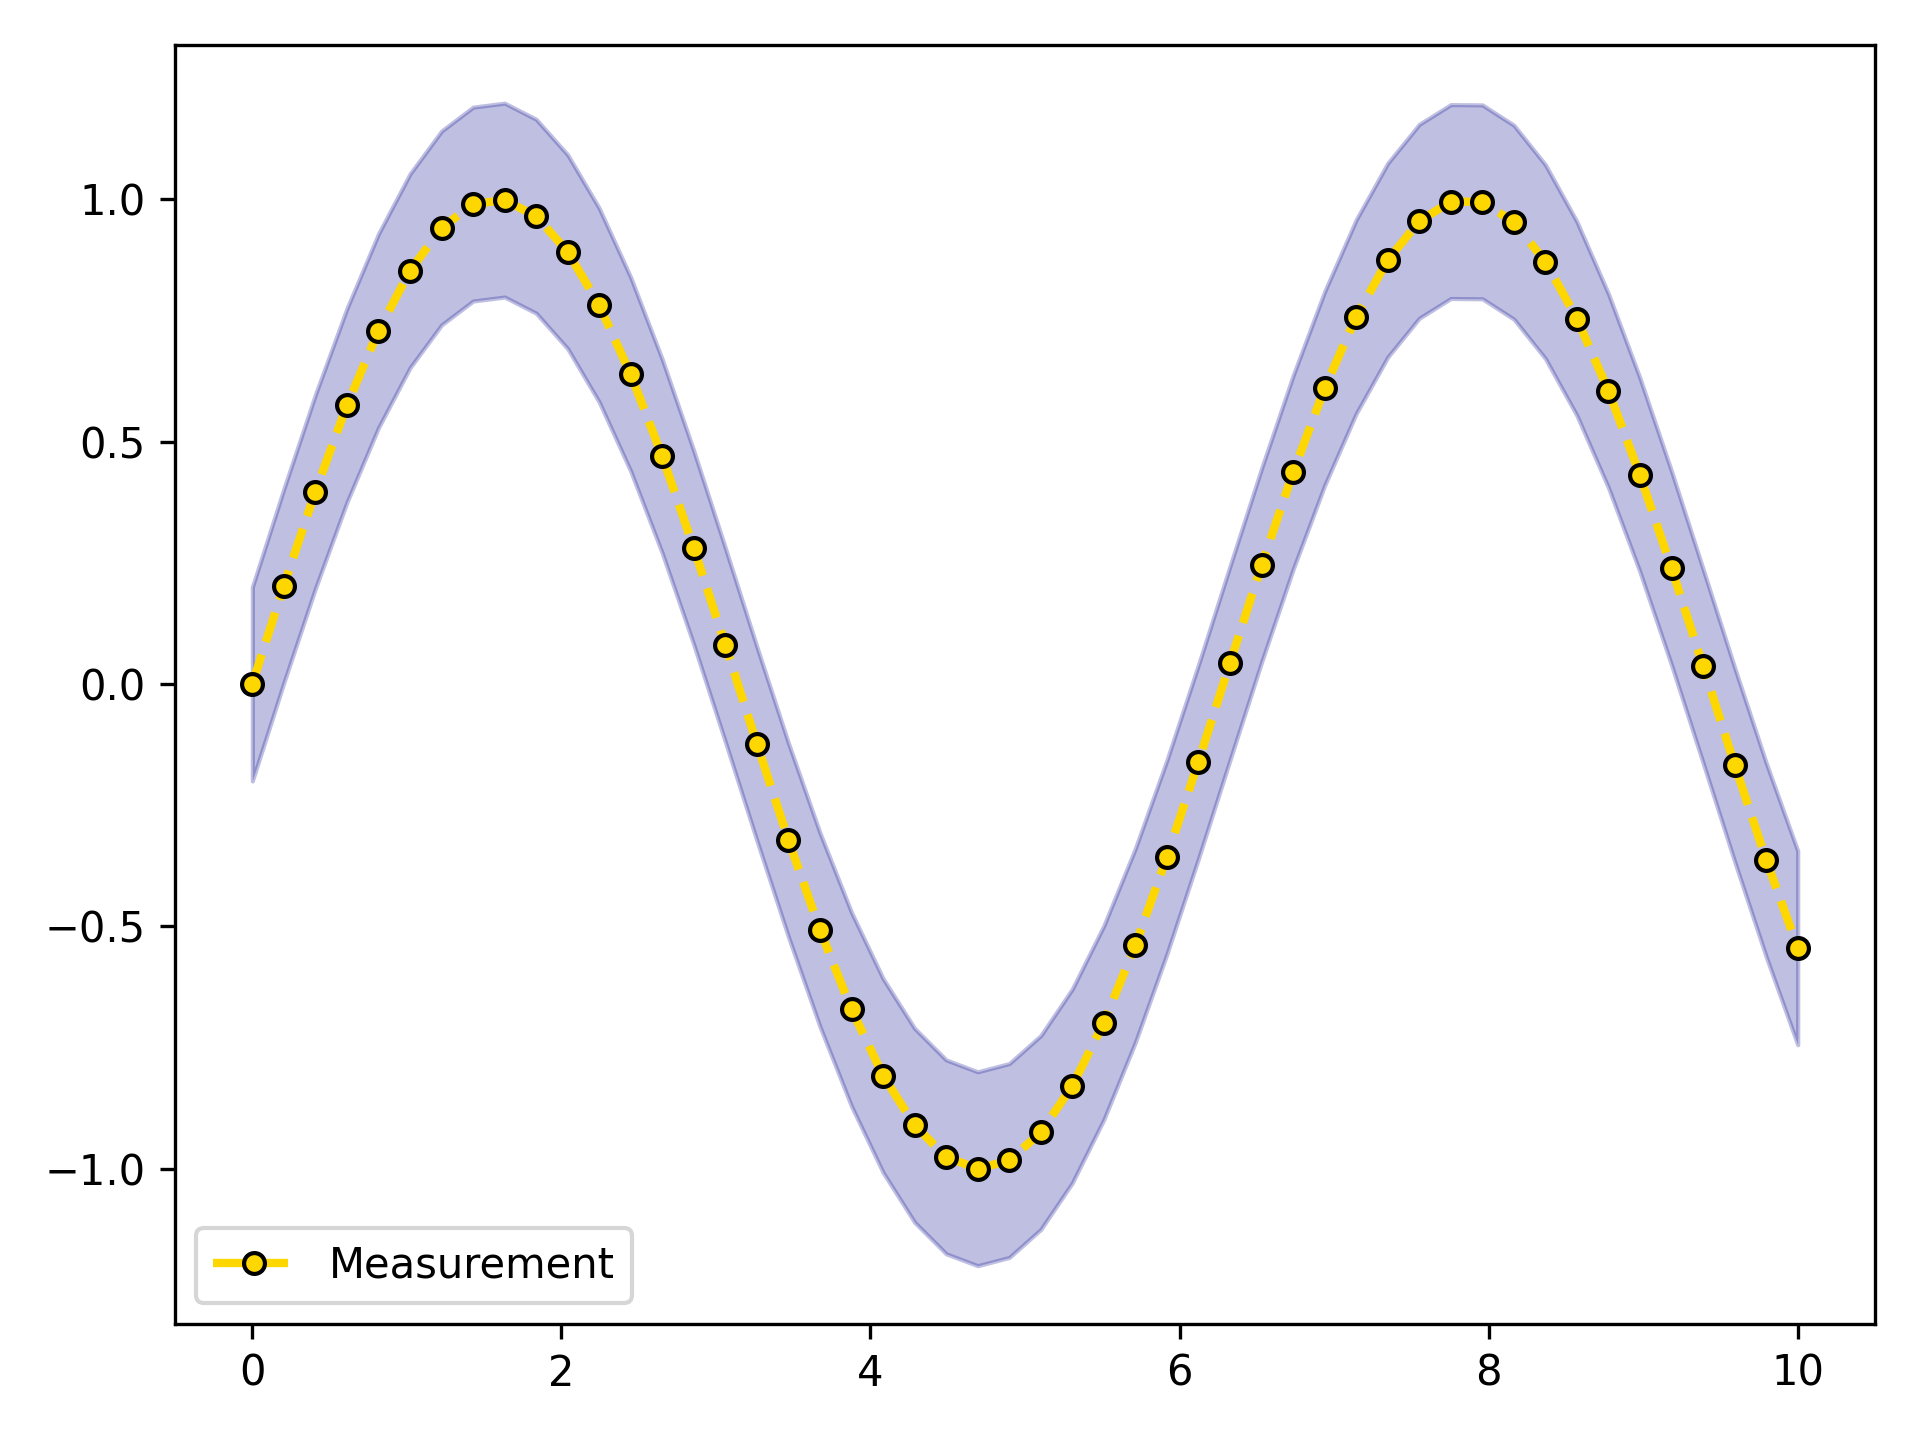
import numpy as np
from plotez import plot_xyy
from plotez.backend import LinePlotConfig

x = np.linspace(0, 10, 50)
y1, y2 = np.sin(x), np.cos(x)

config = LinePlotConfig(
    linestyle=["--", "-."],
    color=["crimson", "gold"],
    marker=["o", "s"],
    markersize=[8, 8],
    markeredgecolor=["black", "black"],
    _extra={"markevery": [5, 5]},
)

plot_xyy(x, y1, y2, plot_config=config, auto_label=True)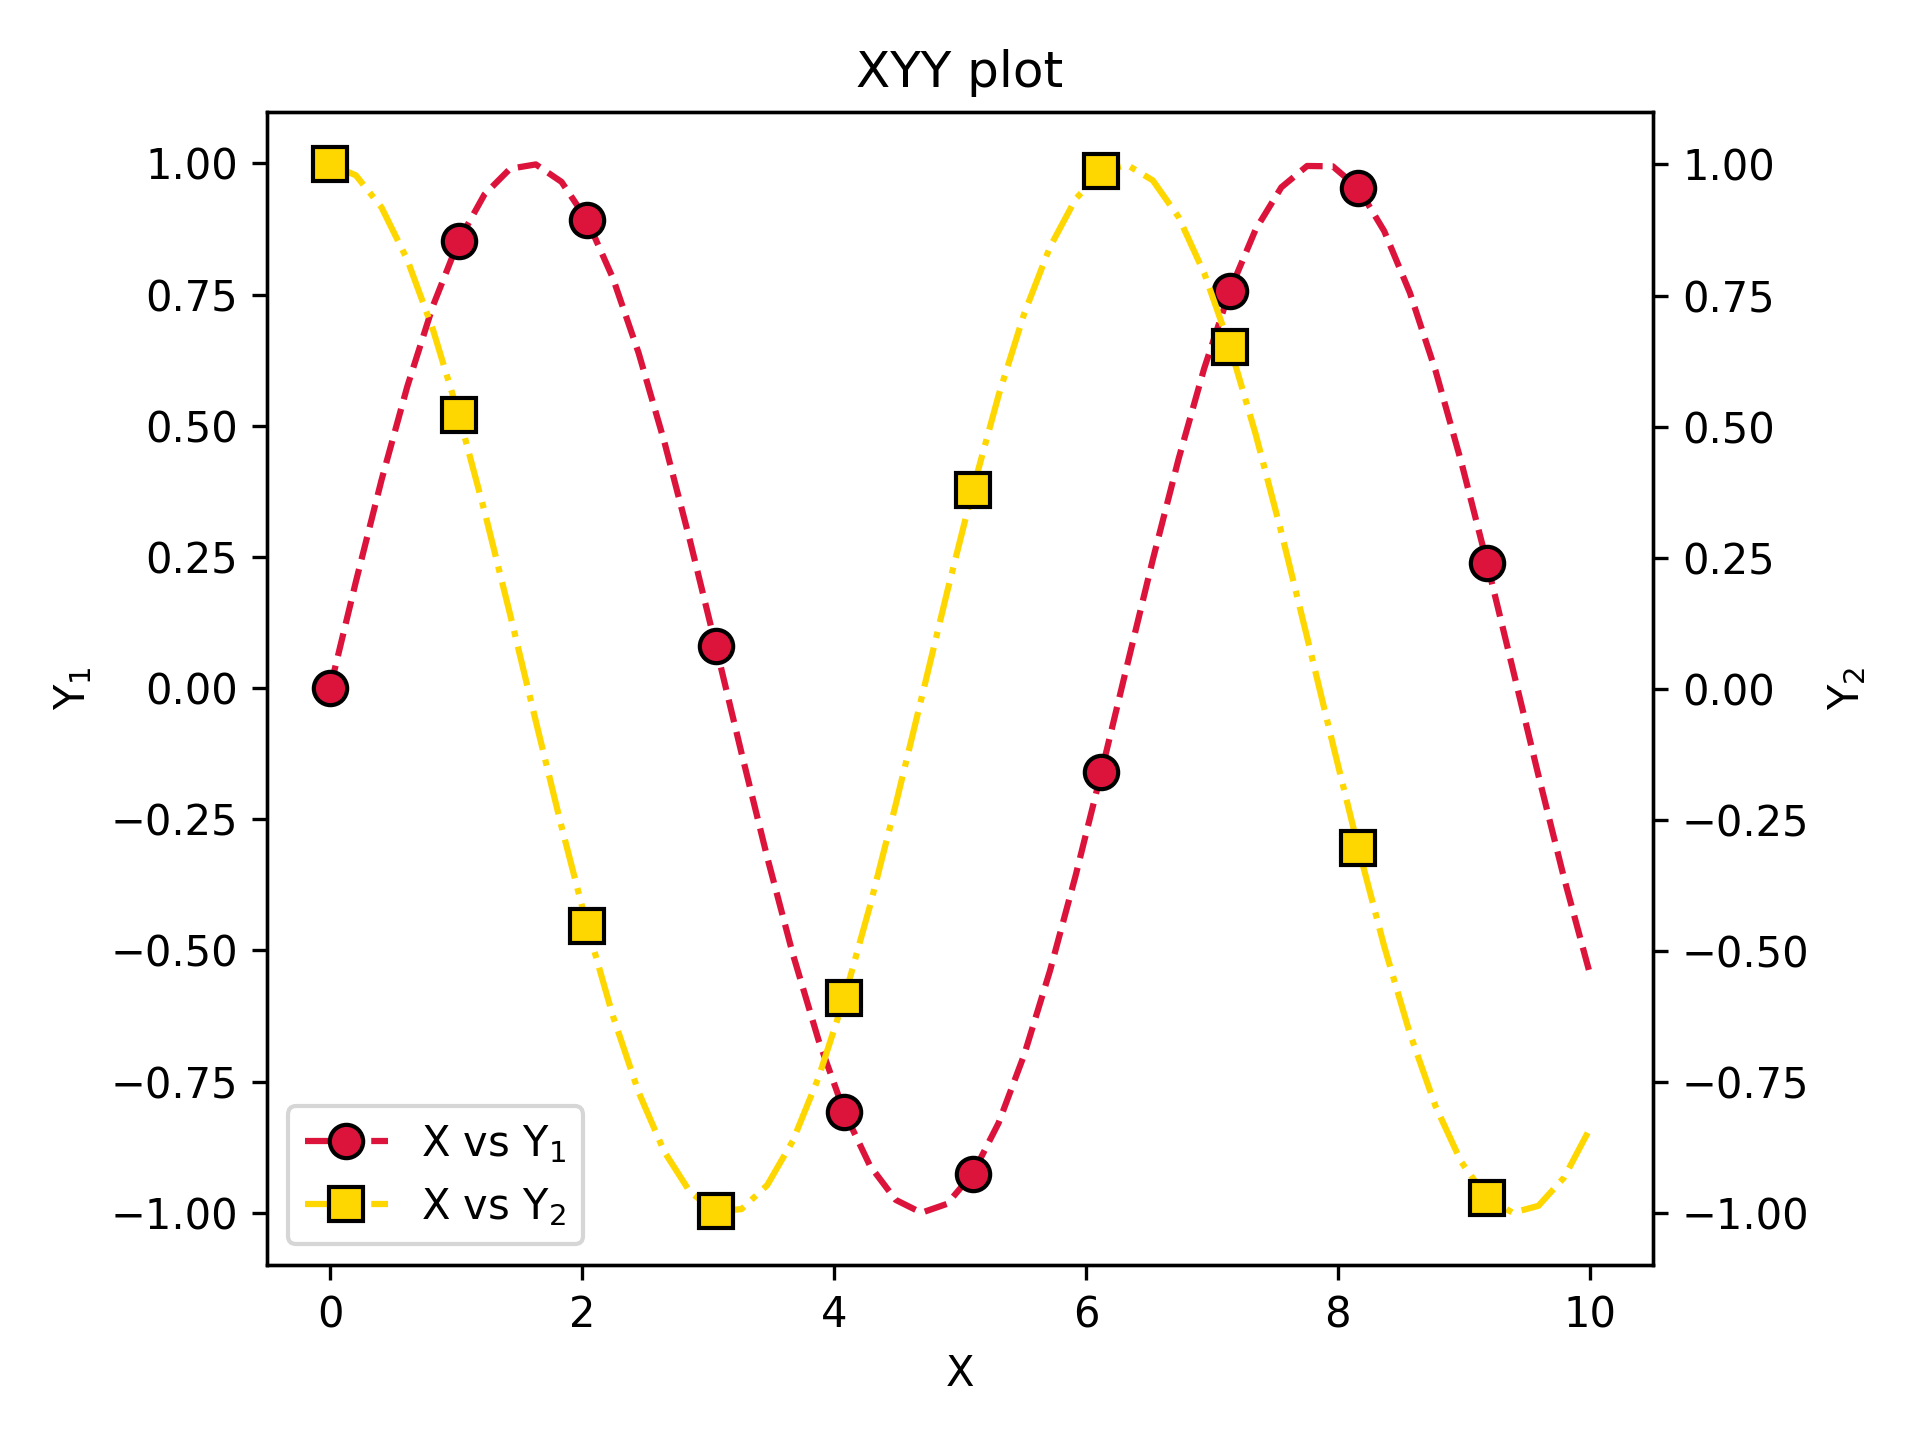
Config classes for when defaults aren't enough. Use _extra to pass any matplotlib parameter not covered by the dataclass fields.
pytestpytest --cov=src/plotez --cov-report=htmlmypy src/plotezcd docs
make html| Item | Status |
|---|---|
| Latest version | v0.2.1 |
| Python support | 3.10 · 3.11 · 3.12 |
| Test coverage | 80%+ |
| Type hints | PEP 561 compliant (py.typed) |
| Documentation | Read the Docs |
| License | MIT |
Contributions are welcome! Please feel free to submit a Pull Request.
MIT License – see LICENSE file for details.
- Syed Ali Mohsin Bukhari - ali.mohsin@ist.edu.pk