Conversation
There was a problem hiding this comment.
Pull request overview
Note
Copilot was unable to run its full agentic suite in this review.
Adds a chat performance benchmarking and memory leak detection harness (with a mock LLM server + scenarios) and wires it into npm scripts and a GitHub Actions workflow for automated comparisons.
Changes:
- Introduces chat perf regression runner + CI Markdown summary generation.
- Adds state-based chat memory leak checker and shared chat-simulation utilities (mock server, scenarios, fixtures, config).
- Adds a GitHub Actions workflow and repo plumbing (.gitignore, build filter, package.json scripts) to run/collect results.
Show a summary per file
| File | Description |
|---|---|
| scripts/chat-simulation/test-chat-perf-regression.js | New perf regression runner that launches VS Code, drives chat scenarios, collects timing/rendering/memory metrics, and compares vs baseline. |
| scripts/chat-simulation/test-chat-mem-leaks.js | New state-based leak checker that cycles chat scenarios across iterations and measures residual heap/DOM growth. |
| scripts/chat-simulation/fixtures/uri.ts | Minimal URI fixture used by tool-call scenarios to read deterministic content. |
| scripts/chat-simulation/fixtures/types.ts | Minimal types helpers fixture used by tool-call scenarios. |
| scripts/chat-simulation/fixtures/strings.ts | Minimal string helpers fixture used by tool-call scenarios. |
| scripts/chat-simulation/fixtures/lifecycle.ts | Minimal lifecycle/disposable fixture used by tool-call scenarios. |
| scripts/chat-simulation/fixtures/event.ts | Minimal event/emitter fixture used by tool-call scenarios. |
| scripts/chat-simulation/fixtures/errors.ts | Minimal error helpers fixture used by tool-call scenarios. |
| scripts/chat-simulation/fixtures/async.ts | Minimal async helpers fixture used by tool-call scenarios. |
| scripts/chat-simulation/fixtures/arrays.ts | Minimal array helpers fixture used by tool-call scenarios. |
| scripts/chat-simulation/config.jsonc | Default knobs for baseline build, runs, and leak thresholds. |
| scripts/chat-simulation/common/utils.js | Shared helpers for config loading, launching VS Code, stats, and inspector connections. |
| scripts/chat-simulation/common/perf-scenarios.js | Built-in scenario catalog (content/tool-calls/multi-turn) registered into the mock server. |
| scripts/chat-simulation/common/mock-llm-server.js | Mock OpenAI/CAPI-like server supporting streaming + multi-turn/tool-call scenarios. |
| package.json | Adds perf:chat and perf:chat-leak npm scripts. |
| build/filters.ts | Excludes .jsonc from the copyright filter. |
| .gitignore | Ignores .chat-simulation-data output directory. |
| .github/workflows/chat-perf.yml | Adds CI workflow to run perf comparisons in parallel groups and upload summaries/artifacts. |
| .github/skills/chat-perf/SKILL.md | Adds documentation for how to run the new perf and leak tools. |
Copilot's findings
Comments suppressed due to low confidence (1)
scripts/chat-simulation/test-chat-mem-leaks.js:1
- The CLI/config option
messagesis parsed but never used by the leak checker logic (the script cycles through all scenarios each iteration regardless). Either removemessagesfrom args/config/help text or implement it (e.g., cap the number of scenarios/messages executed per iteration) so the flag has an effect.
/*---------------------------------------------------------------------------------------------
- Files reviewed: 18/19 changed files
- Comments generated: 8
| await cdp.send('Tracing.start', { | ||
| traceConfig: { | ||
| includedCategories: ['v8.gc', 'devtools.timeline'], | ||
| recordMode: 'recordContinuously', | ||
| } | ||
| }); |
There was a problem hiding this comment.
Tracing is started long before the Tracing.dataCollected listener is attached, so early trace events can be missed (listeners only receive events after subscription). Attach the Tracing.dataCollected handler immediately before/after Tracing.start (and clear traceEvents at that point) so the trace covers the full interaction deterministically.
| /** @type {Array<any>} */ | ||
| const traceEvents = []; | ||
| cdp.on('Tracing.dataCollected', (/** @type {any} */ data) => { traceEvents.push(...data.value); }); | ||
| const tracingComplete = new Promise(resolve => { | ||
| cdp.once('Tracing.tracingComplete', () => resolve(undefined)); | ||
| }); |
There was a problem hiding this comment.
Tracing is started long before the Tracing.dataCollected listener is attached, so early trace events can be missed (listeners only receive events after subscription). Attach the Tracing.dataCollected handler immediately before/after Tracing.start (and clear traceEvents at that point) so the trace covers the full interaction deterministically.
| /** @type {Array<any>} */ | |
| const traceEvents = []; | |
| cdp.on('Tracing.dataCollected', (/** @type {any} */ data) => { traceEvents.push(...data.value); }); | |
| const tracingComplete = new Promise(resolve => { | |
| cdp.once('Tracing.tracingComplete', () => resolve(undefined)); | |
| }); | |
| // `traceEvents` and `tracingComplete` must be initialized alongside | |
| // `Tracing.start` so no early trace events are missed. |
| if (!cur || !bas || !bas.median) { continue; } | ||
| const change = (cur.median - bas.median) / bas.median; |
There was a problem hiding this comment.
The guard !bas.median incorrectly skips metrics when the baseline median is 0 (valid for some counters). Use an explicit null/undefined check (e.g. bas.median === null || bas.median === undefined) and handle the bas.median === 0 denominator case consistently (similar to the logic used elsewhere in the file).
| if (!cur || !bas || !bas.median) { continue; } | |
| const change = (cur.median - bas.median) / bas.median; | |
| if (!cur || !bas || bas.median === null || bas.median === undefined) { continue; } | |
| const change = bas.median !== 0 ? (cur.median - bas.median) / bas.median : 0; |
| Launches one VS Code session, sends N messages sequentially, forces GC between each, and measures renderer heap and DOM node count. Uses **linear regression** on the samples to compute per-message growth rate, which is compared against a threshold. | ||
|
|
||
| ### Key flags | ||
|
|
||
| | Flag | Default | Description | | ||
| |---|---|---| | ||
| | `--messages <n>` / `-n` | `10` | Number of messages to send. More = more accurate slope. | | ||
| | `--build <path\|ver>` / `-b` | local dev | Build to test. | | ||
| | `--threshold <MB>` | `2` | Max per-message heap growth in MB. | | ||
| | `--verbose` | — | Print per-message heap/DOM counts. | | ||
|
|
||
| ### What it measures | ||
|
|
||
| - **Heap growth slope** (MB/message) — linear regression over forced-GC heap samples. A leak shows as sustained positive slope. | ||
| - **DOM node growth** (nodes/message) — catches rendering leaks where elements aren't cleaned up. Healthy chat virtualizes old messages so node count plateaus. | ||
|
|
||
| ### Interpreting results | ||
|
|
||
| - `0.3–1.0 MB/msg` — normal (V8 internal overhead, string interning) | ||
| - `>2.0 MB/msg` — likely leak, investigate retained objects | ||
| - DOM nodes stable after first message — normal (chat list virtualization working) | ||
| - DOM nodes growing linearly — rendering leak, check disposable cleanup |
There was a problem hiding this comment.
The SKILL documentation describes a per-message linear-regression leak test controlled by --messages, but test-chat-mem-leaks.js currently implements a state-based iteration approach (cycle all scenarios, then reset) and does not use messages or compute a slope. Update the SKILL doc to match the implemented algorithm/flags (or adjust the script to match the documented behavior).
| Launches one VS Code session, sends N messages sequentially, forces GC between each, and measures renderer heap and DOM node count. Uses **linear regression** on the samples to compute per-message growth rate, which is compared against a threshold. | |
| ### Key flags | |
| | Flag | Default | Description | | |
| |---|---|---| | |
| | `--messages <n>` / `-n` | `10` | Number of messages to send. More = more accurate slope. | | |
| | `--build <path\|ver>` / `-b` | local dev | Build to test. | | |
| | `--threshold <MB>` | `2` | Max per-message heap growth in MB. | | |
| | `--verbose` | — | Print per-message heap/DOM counts. | | |
| ### What it measures | |
| - **Heap growth slope** (MB/message) — linear regression over forced-GC heap samples. A leak shows as sustained positive slope. | |
| - **DOM node growth** (nodes/message) — catches rendering leaks where elements aren't cleaned up. Healthy chat virtualizes old messages so node count plateaus. | |
| ### Interpreting results | |
| - `0.3–1.0 MB/msg` — normal (V8 internal overhead, string interning) | |
| - `>2.0 MB/msg` — likely leak, investigate retained objects | |
| - DOM nodes stable after first message — normal (chat list virtualization working) | |
| - DOM nodes growing linearly — rendering leak, check disposable cleanup | |
| Launches one VS Code session, cycles through the built-in chat scenarios, forces GC between iterations, and measures renderer heap and DOM node count. After completing a full scenario pass, the test resets and repeats so it can detect retained state that accumulates across scenario cycles. | |
| ### Key flags | |
| | Flag | Default | Description | | |
| |---|---|---| | |
| | `--build <path\|ver>` / `-b` | local dev | Build to test. | | |
| | `--threshold <MB>` | `2` | Maximum retained heap growth allowed before the run is treated as suspicious. | | |
| | `--verbose` | — | Print per-iteration heap and DOM counts. | | |
| ### What it measures | |
| - **Retained heap after forced GC** (MB) — catches memory that survives scenario execution and reset boundaries. | |
| - **DOM node count across iterations** — catches rendering leaks where elements or widgets are not cleaned up after scenario completion. | |
| - **Growth across scenario cycles** — the important signal is whether heap or node counts keep rising after each full pass instead of returning to a stable range. | |
| ### Interpreting results | |
| - Small first-iteration increases are normal (startup, caches, JIT, string interning). | |
| - Heap that keeps increasing after each full scenario cycle is suspicious and should be investigated for retained objects. | |
| - DOM nodes returning to a steady range after reset is normal. | |
| - DOM nodes or heap continuing to climb from cycle to cycle indicates a likely rendering or lifecycle leak; check disposable cleanup and retained references. |
| Launches one VS Code session, sends N messages sequentially, forces GC between each, and measures renderer heap and DOM node count. Uses **linear regression** on the samples to compute per-message growth rate, which is compared against a threshold. | ||
|
|
||
| ### Key flags | ||
|
|
||
| | Flag | Default | Description | | ||
| |---|---|---| | ||
| | `--messages <n>` / `-n` | `10` | Number of messages to send. More = more accurate slope. | | ||
| | `--build <path\|ver>` / `-b` | local dev | Build to test. | | ||
| | `--threshold <MB>` | `2` | Max per-message heap growth in MB. | | ||
| | `--verbose` | — | Print per-message heap/DOM counts. | | ||
|
|
||
| ### What it measures | ||
|
|
||
| - **Heap growth slope** (MB/message) — linear regression over forced-GC heap samples. A leak shows as sustained positive slope. | ||
| - **DOM node growth** (nodes/message) — catches rendering leaks where elements aren't cleaned up. Healthy chat virtualizes old messages so node count plateaus. | ||
|
|
||
| ### Interpreting results | ||
|
|
||
| - `0.3–1.0 MB/msg` — normal (V8 internal overhead, string interning) | ||
| - `>2.0 MB/msg` — likely leak, investigate retained objects | ||
| - DOM nodes stable after first message — normal (chat list virtualization working) | ||
| - DOM nodes growing linearly — rendering leak, check disposable cleanup |
There was a problem hiding this comment.
The SKILL documentation describes a per-message linear-regression leak test controlled by --messages, but test-chat-mem-leaks.js currently implements a state-based iteration approach (cycle all scenarios, then reset) and does not use messages or compute a slope. Update the SKILL doc to match the implemented algorithm/flags (or adjust the script to match the documented behavior).
| Launches one VS Code session, sends N messages sequentially, forces GC between each, and measures renderer heap and DOM node count. Uses **linear regression** on the samples to compute per-message growth rate, which is compared against a threshold. | |
| ### Key flags | |
| | Flag | Default | Description | | |
| |---|---|---| | |
| | `--messages <n>` / `-n` | `10` | Number of messages to send. More = more accurate slope. | | |
| | `--build <path\|ver>` / `-b` | local dev | Build to test. | | |
| | `--threshold <MB>` | `2` | Max per-message heap growth in MB. | | |
| | `--verbose` | — | Print per-message heap/DOM counts. | | |
| ### What it measures | |
| - **Heap growth slope** (MB/message) — linear regression over forced-GC heap samples. A leak shows as sustained positive slope. | |
| - **DOM node growth** (nodes/message) — catches rendering leaks where elements aren't cleaned up. Healthy chat virtualizes old messages so node count plateaus. | |
| ### Interpreting results | |
| - `0.3–1.0 MB/msg` — normal (V8 internal overhead, string interning) | |
| - `>2.0 MB/msg` — likely leak, investigate retained objects | |
| - DOM nodes stable after first message — normal (chat list virtualization working) | |
| - DOM nodes growing linearly — rendering leak, check disposable cleanup | |
| Launches one VS Code session, cycles through the built-in chat scenarios repeatedly, forces GC between iterations, and measures renderer heap and DOM node count after each pass. The test uses these state-based samples to detect sustained growth across repeated scenario cycles, rather than computing a per-message linear-regression slope. | |
| ### Key flags | |
| | Flag | Default | Description | | |
| |---|---|---| | |
| | `--build <path\|ver>` / `-b` | local dev | Build to test. | | |
| | `--threshold <MB>` | `2` | Max allowed renderer heap growth over the leak-check run. | | |
| | `--verbose` | — | Print per-iteration heap/DOM counts. | | |
| ### What it measures | |
| - **Renderer heap growth** (MB over repeated scenario iterations) — forced-GC heap samples are compared across the run to catch retained state that does not get cleaned up between scenario cycles. | |
| - **DOM node growth** (nodes over repeated scenario iterations) — catches rendering leaks where elements are retained instead of being released or virtualized as chat state is exercised and reset. | |
| ### Interpreting results | |
| - Small heap fluctuations between iterations are normal (V8 internal overhead, caching, string interning). | |
| - Heap usage that keeps climbing across repeated scenario cycles is a likely leak; investigate retained objects and lifecycle cleanup. | |
| - DOM nodes that stabilize after the initial iterations are normal (chat list virtualization and cleanup working). | |
| - DOM nodes that continue growing across iterations suggest a rendering leak; check disposable cleanup and retained elements. |
| /** @param {string} text */ | ||
| function stripJsoncComments(text) { return text.replace(/\/\/.*/g, '').replace(/\/\*[\s\S]*?\*\//g, ''); } |
There was a problem hiding this comment.
The JSONC comment stripper uses regexes that will also remove // and /* */ sequences inside string literals (e.g. URLs like http://...), which can corrupt the JSON before parsing. Prefer a JSONC parser (e.g. jsonc-parser) or a safer comment-stripping approach that respects quoted strings.
| function loadConfig(section) { | ||
| const raw = fs.readFileSync(path.join(__dirname, '..', 'config.jsonc'), 'utf-8'); | ||
| const config = JSON.parse(stripJsoncComments(raw)); | ||
| return config[section] ?? {}; | ||
| } |
There was a problem hiding this comment.
The JSONC comment stripper uses regexes that will also remove // and /* */ sequences inside string literals (e.g. URLs like http://...), which can corrupt the JSON before parsing. Prefer a JSONC parser (e.g. jsonc-parser) or a safer comment-stripping approach that respects quoted strings.
| on: | ||
| pull_request: | ||
| paths: | ||
| - '.github/workflows/chat-perf.yml' |
There was a problem hiding this comment.
This workflow only runs on PRs that modify the workflow file itself, so it won't gate chat-related changes (despite the skill doc describing CI gating for chat UI work). Consider expanding the pull_request.paths filter to include relevant chat areas (e.g. src/vs/workbench/contrib/chat/**, extensions/copilot/**, and/or scripts/chat-simulation/**) or remove the PR-triggered gating claims from docs.
| - '.github/workflows/chat-perf.yml' | |
| - '.github/workflows/chat-perf.yml' | |
| - 'src/vs/workbench/contrib/chat/**' | |
| - 'extensions/copilot/**' | |
| - 'scripts/chat-simulation/**' |
Screenshot ChangesBase: Changed (98)
|
| Before | After |
|---|---|
 |
 |
sessions/updateHoverWidget/UpdateHoverReady/Light
| Before | After |
|---|---|
 |
 |
sessions/updateHoverWidget/UpdateHoverAvailableForDownload/Dark
| Before | After |
|---|---|
 |
 |
sessions/updateHoverWidget/UpdateHoverAvailableForDownload/Light
| Before | After |
|---|---|
 |
 |
sessions/updateHoverWidget/UpdateHoverDownloading30Percent/Dark
| Before | After |
|---|---|
 |
 |
sessions/updateHoverWidget/UpdateHoverDownloading30Percent/Light
| Before | After |
|---|---|
 |
 |
sessions/updateHoverWidget/UpdateHoverInstalling/Dark
| Before | After |
|---|---|
 |
 |
sessions/updateHoverWidget/UpdateHoverInstalling/Light
| Before | After |
|---|---|
 |
 |
sessions/updateHoverWidget/UpdateHoverUpdating/Dark
| Before | After |
|---|---|
 |
 |
sessions/updateHoverWidget/UpdateHoverUpdating/Light
| Before | After |
|---|---|
 |
 |
sessions/updateHoverWidget/UpdateHoverSameVersion/Dark
| Before | After |
|---|---|
 |
 |
sessions/updateHoverWidget/UpdateHoverSameVersion/Light
| Before | After |
|---|---|
 |
 |
sessions/agentFeedback/agentFeedbackEditorOverlayWidget/ZeroOfZero/Dark
| Before | After |
|---|---|
 |
 |
sessions/agentFeedback/agentFeedbackEditorOverlayWidget/ZeroOfZero/Light
| Before | After |
|---|---|
 |
 |
sessions/agentFeedback/agentFeedbackEditorOverlayWidget/SingleFeedback/Dark
| Before | After |
|---|---|
 |
 |
sessions/agentFeedback/agentFeedbackEditorOverlayWidget/SingleFeedback/Light
| Before | After |
|---|---|
 |
 |
sessions/agentFeedback/agentFeedbackEditorOverlayWidget/FirstOfThree/Dark
| Before | After |
|---|---|
 |
 |
sessions/agentFeedback/agentFeedbackEditorOverlayWidget/FirstOfThree/Light
| Before | After |
|---|---|
 |
 |
sessions/agentFeedback/agentFeedbackEditorOverlayWidget/ReviewOnlyTwoComments/Dark
| Before | After |
|---|---|
 |
 |
sessions/agentFeedback/agentFeedbackEditorOverlayWidget/ReviewOnlyTwoComments/Light
| Before | After |
|---|---|
 |
 |
sessions/agentFeedback/agentFeedbackEditorOverlayWidget/MiddleOfThree/Dark
| Before | After |
|---|---|
 |
 |
sessions/agentFeedback/agentFeedbackEditorOverlayWidget/MiddleOfThree/Light
| Before | After |
|---|---|
 |
 |
sessions/agentFeedback/agentFeedbackEditorOverlayWidget/MixedFourComments/Dark
| Before | After |
|---|---|
 |
 |
sessions/agentFeedback/agentFeedbackEditorOverlayWidget/MixedFourComments/Light
| Before | After |
|---|---|
 |
 |
sessions/agentFeedback/agentFeedbackEditorOverlayWidget/LastOfThree/Dark
| Before | After |
|---|---|
 |
 |
sessions/agentFeedback/agentFeedbackEditorOverlayWidget/LastOfThree/Light
| Before | After |
|---|---|
 |
 |
sessions/agentFeedback/agentFeedbackEditorWidget/CollapsedSingleComment/Dark
| Before | After |
|---|---|
 |
 |
sessions/agentFeedback/agentFeedbackEditorWidget/CollapsedSingleComment/Light
| Before | After |
|---|---|
 |
 |
sessions/agentFeedback/agentFeedbackEditorWidget/ExpandedSingleComment/Dark
| Before | After |
|---|---|
 |
 |
sessions/agentFeedback/agentFeedbackEditorWidget/ExpandedSingleComment/Light
| Before | After |
|---|---|
 |
 |
sessions/agentFeedback/agentFeedbackEditorWidget/CollapsedMultiComment/Dark
| Before | After |
|---|---|
 |
 |
sessions/agentFeedback/agentFeedbackEditorWidget/CollapsedMultiComment/Light
| Before | After |
|---|---|
 |
 |
sessions/agentFeedback/agentFeedbackEditorWidget/ExpandedMultiComment/Dark
| Before | After |
|---|---|
 |
 |
sessions/agentFeedback/agentFeedbackEditorWidget/ExpandedMultiComment/Light
| Before | After |
|---|---|
 |
 |
sessions/agentFeedback/agentFeedbackEditorWidget/ExpandedFocusedFeedback/Dark
| Before | After |
|---|---|
 |
 |
sessions/agentFeedback/agentFeedbackEditorWidget/ExpandedFocusedFeedback/Light
| Before | After |
|---|---|
 |
 |
sessions/agentFeedback/agentFeedbackEditorWidget/ExpandedReviewOnly/Dark
| Before | After |
|---|---|
 |
 |
sessions/agentFeedback/agentFeedbackEditorWidget/ExpandedReviewOnly/Light
| Before | After |
|---|---|
 |
 |
sessions/agentFeedback/agentFeedbackEditorWidget/ExpandedMixedComments/Dark
| Before | After |
|---|---|
 |
 |
sessions/agentFeedback/agentFeedbackEditorWidget/ExpandedMixedComments/Light
| Before | After |
|---|---|
 |
 |
sessions/agentFeedback/agentFeedbackEditorWidget/ExpandedFocusedReviewComment/Dark
| Before | After |
|---|---|
 |
 |
sessions/agentFeedback/agentFeedbackEditorWidget/ExpandedFocusedReviewComment/Light
| Before | After |
|---|---|
 |
 |
sessions/agentFeedback/agentFeedbackEditorWidget/ExpandedReviewSuggestion/Dark
| Before | After |
|---|---|
 |
 |
sessions/agentFeedback/agentFeedbackEditorWidget/ExpandedReviewSuggestion/Light
| Before | After |
|---|---|
 |
 |
sessions/agentFeedback/agentFeedbackEditorWidget/ExpandedPRReviewOnly/Dark
| Before | After |
|---|---|
 |
 |
sessions/agentFeedback/agentFeedbackEditorWidget/ExpandedPRReviewOnly/Light
| Before | After |
|---|---|
 |
 |
sessions/agentFeedback/agentFeedbackEditorWidget/ExpandedAllSourcesMixed/Dark
| Before | After |
|---|---|
 |
 |
sessions/agentFeedback/agentFeedbackEditorWidget/ExpandedAllSourcesMixed/Light
| Before | After |
|---|---|
 |
 |
sessions/agentFeedback/agentFeedbackEditorWidget/ExpandedFocusedPRReview/Dark
| Before | After |
|---|---|
 |
 |
sessions/agentFeedback/agentFeedbackEditorWidget/ExpandedFocusedPRReview/Light
| Before | After |
|---|---|
 |
 |
sessions/agentFeedback/agentFeedbackEditorWidget/HiddenWidget/Dark
| Before | After |
|---|---|
 |
 |
sessions/agentFeedback/agentFeedbackEditorWidget/HiddenWidget/Light
| Before | After |
|---|---|
 |
 |
sessions/aiCustomizationShortcutsWidget/Collapsed/Dark
| Before | After |
|---|---|
 |
 |
sessions/aiCustomizationShortcutsWidget/Collapsed/Light
| Before | After |
|---|---|
 |
 |
sessions/aiCustomizationShortcutsWidget/CollapsedWithMcpServers/Dark
| Before | After |
|---|---|
 |
 |
sessions/aiCustomizationShortcutsWidget/CollapsedWithMcpServers/Light
| Before | After |
|---|---|
 |
 |
chat/aiStats/AiStatsHover/Dark
| Before | After |
|---|---|
 |
 |
chat/aiStats/AiStatsHover/Light
| Before | After |
|---|---|
 |
 |
chat/aiStats/AiStatsHoverNoData/Dark
| Before | After |
|---|---|
 |
 |
chat/aiStats/AiStatsHoverNoData/Light
| Before | After |
|---|---|
 |
 |
editor/codeActionList/SimpleQuickFixes/Dark
| Before | After |
|---|---|
 |
 |
editor/codeActionList/SimpleQuickFixes/Light
| Before | After |
|---|---|
 |
 |
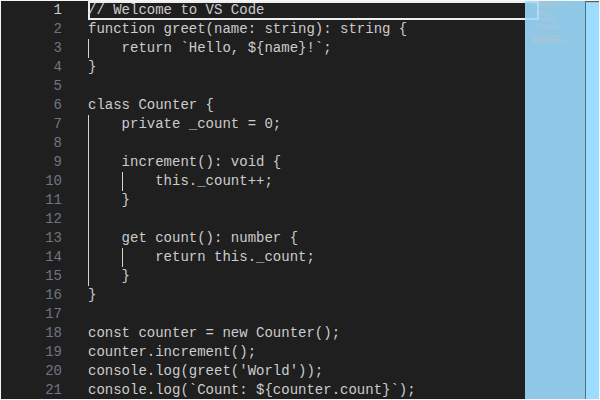
editor/codeEditor/CodeEditor/Dark
| Before | After |
|---|---|
 |
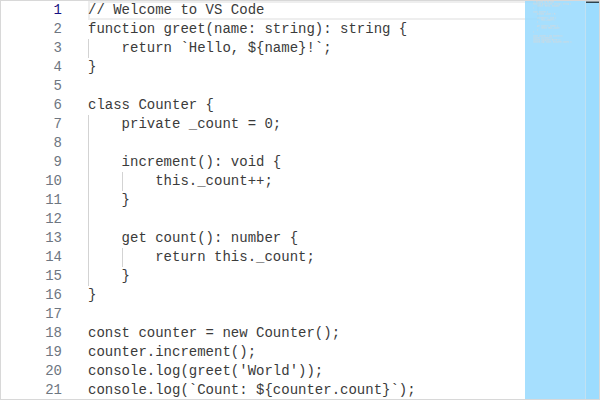
 |
editor/codeEditor/CodeEditor/Light
| Before | After |
|---|---|
 |
 |
editor/inlineChatAffordance/InlineChatAffordance/Dark
| Before | After |
|---|---|
 |
 |
editor/inlineChatAffordance/InlineChatAffordance/Light
| Before | After |
|---|---|
 |
 |
editor/inlineChatAffordance/InlineChatOverlay/Dark
| Before | After |
|---|---|
 |
 |
editor/inlineChatAffordance/InlineChatOverlay/Light
| Before | After |
|---|---|
 |
 |
editor/inlineCompletions/other/HintsToolbar/Dark
| Before | After |
|---|---|
 |
 |
editor/inlineCompletions/other/HintsToolbar/Light
| Before | After |
|---|---|
 |
 |
editor/inlineCompletions/other/HintsToolbarHovered/Dark
| Before | After |
|---|---|
|
|
editor/inlineCompletions/other/HintsToolbarHovered/Light
| Before | After |
|---|---|
|
|
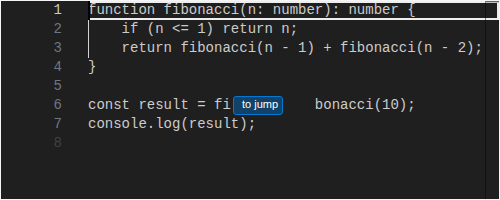
editor/inlineCompletions/other/JumpToHint/Dark
| Before | After |
|---|---|
 |
 |
editor/inlineCompletions/other/JumpToHint/Light
| Before | After |
|---|---|
 |
 |
editor/inlineCompletions/other/NextFileEditSuggestion/Dark
| Before | After |
|---|---|
 |
 |
editor/inlineCompletions/other/NextFileEditSuggestion/Light
| Before | After |
|---|---|
 |
 |
editor/inlineCompletions/other/GutterMenu/Dark
| Before | After |
|---|---|
 |
 |
editor/inlineCompletions/other/GutterMenu/Light
| Before | After |
|---|---|
 |
 |
editor/inlineCompletions/views/SideBySideViewSmall/Dark
| Before | After |
|---|---|
 |
 |
editor/inlineCompletions/views/SideBySideViewSmall/Light
| Before | After |
|---|---|
 |
 |
editor/inlineCompletions/views/SideBySideViewWide/Dark
| Before | After |
|---|---|
 |
 |
editor/inlineCompletions/views/SideBySideViewWide/Light
| Before | After |
|---|---|
 |
 |
editor/inlineCompletions/views/WordReplacementView/Dark
| Before | After |
|---|---|
 |
 |
editor/inlineCompletions/views/WordReplacementView/Light
| Before | After |
|---|---|
 |
 |
editor/inlineCompletions/views/DeletionView/Dark
| Before | After |
|---|---|
 |
 |
editor/inlineCompletions/views/DeletionView/Light
| Before | After |
|---|---|
 |
 |
editor/inlineCompletions/views/LineReplacementView/Dark
| Before | After |
|---|---|
 |
 |
editor/inlineCompletions/views/LineReplacementView/Light
| Before | After |
|---|---|
 |
 |
editor/multiDiffEditor/MultiDiffEditor/Dark
| Before | After |
|---|---|
 |
 |
editor/multiDiffEditor/MultiDiffEditor/Light
| Before | After |
|---|---|
 |
 |
editor/suggestWidget/MethodCompletions/Dark
| Before | After |
|---|---|
 |
 |
editor/suggestWidget/MethodCompletions/Light
| Before | After |
|---|---|
 |
 |
editor/suggestWidget/MixedKinds/Dark
| Before | After |
|---|---|
 |
 |
editor/suggestWidget/MixedKinds/Light
| Before | After |
|---|---|
 |
 |
peekReference/PeekReferences/Dark
| Before | After |
|---|---|
 |
 |
peekReference/PeekReferences/Light
| Before | After |
|---|---|
 |
 |
imageCarousel/imageCarousel/MultipleSections/Dark
| Before | After |
|---|---|
 |
 |
imageCarousel/imageCarousel/MultipleSections/Light
| Before | After |
|---|---|
 |
 |
Added (2)
chat/aiCustomizations/aiCustomizationWelcomePages/WelcomePage/Dark

chat/aiCustomizations/aiCustomizationWelcomePages/WelcomePage/Light

Removed (8)
chat/aiCustomizations/aiCustomizationWelcomePages/WelcomePageClassic/Dark

chat/aiCustomizations/aiCustomizationWelcomePages/WelcomePageClassic/Light

chat/aiCustomizations/aiCustomizationWelcomePages/WelcomePagePromptLaunchers/Dark
chat/aiCustomizations/aiCustomizationWelcomePages/WelcomePagePromptLaunchers/Light
chat/aiCustomizations/aiCustomizationWelcomePages/WelcomePageSelectorClassic/Dark
chat/aiCustomizations/aiCustomizationWelcomePages/WelcomePageSelectorClassic/Light
chat/aiCustomizations/aiCustomizationWelcomePages/WelcomePageSelectorPromptLaunchers/Dark
chat/aiCustomizations/aiCustomizationWelcomePages/WelcomePageSelectorPromptLaunchers/Light
blocks-ci screenshots changed
Replace the contents of test/componentFixtures/blocks-ci-screenshots.md with:
Updated blocks-ci-screenshots.md
<!-- auto-generated by CI — do not edit manually -->
#### editor/codeEditor/CodeEditor/Dark

#### editor/codeEditor/CodeEditor/Light

No description provided.