This repository was archived by the owner on Jan 10, 2023. It is now read-only.
Node.js profiling
You need to build it from source after making next changes:
- in deps/v8/include/v8.h file change:
Handle<Script> script;
to
Handle<UnboundScript> script;
- in deps/v8/src/log.cc file, function
void JitLogger::LogRecordedBuffer(...), change
event.script = ToApiHandle<v8::UScript>(script_handle);
to
event.script = ToApiHandle<v8::UnboundScript>(script_handle);
- in /deps/v8/src/third_party/vtune/vtune-jit.cc file, function
void VTUNEJITInterface::event_handler(const v8::JitCodeEvent* event), change:
Handle<Script> script = event->script;
to
Handle<UnboundScript> script = event->script;
- Add next lines in /src/node.cc
#include "v8-vtune.h" // located in \deps\v8\src\third_party\vtune

void Init(...) {
    …
    V8::SetFlagsFromCommandLine(&v8_argc, const_cast(v8_argv), true);
    vTune::InitializeVtuneForV8();
}- Add 1 line in /node.gyp file:
   'target_name': 'node',
   'type': 'executable',
   'dependencies': [
       'node_js2c#host',
       'deps/v8/src/third_party/vtune/v8vtune.gyp:v8_vtune',
], - Run "vcbuild.bat nosign" located in root folder
Then:
$ ./configure --enable-vtune-profiling $ ./make
Run cmd with Administrative rights:
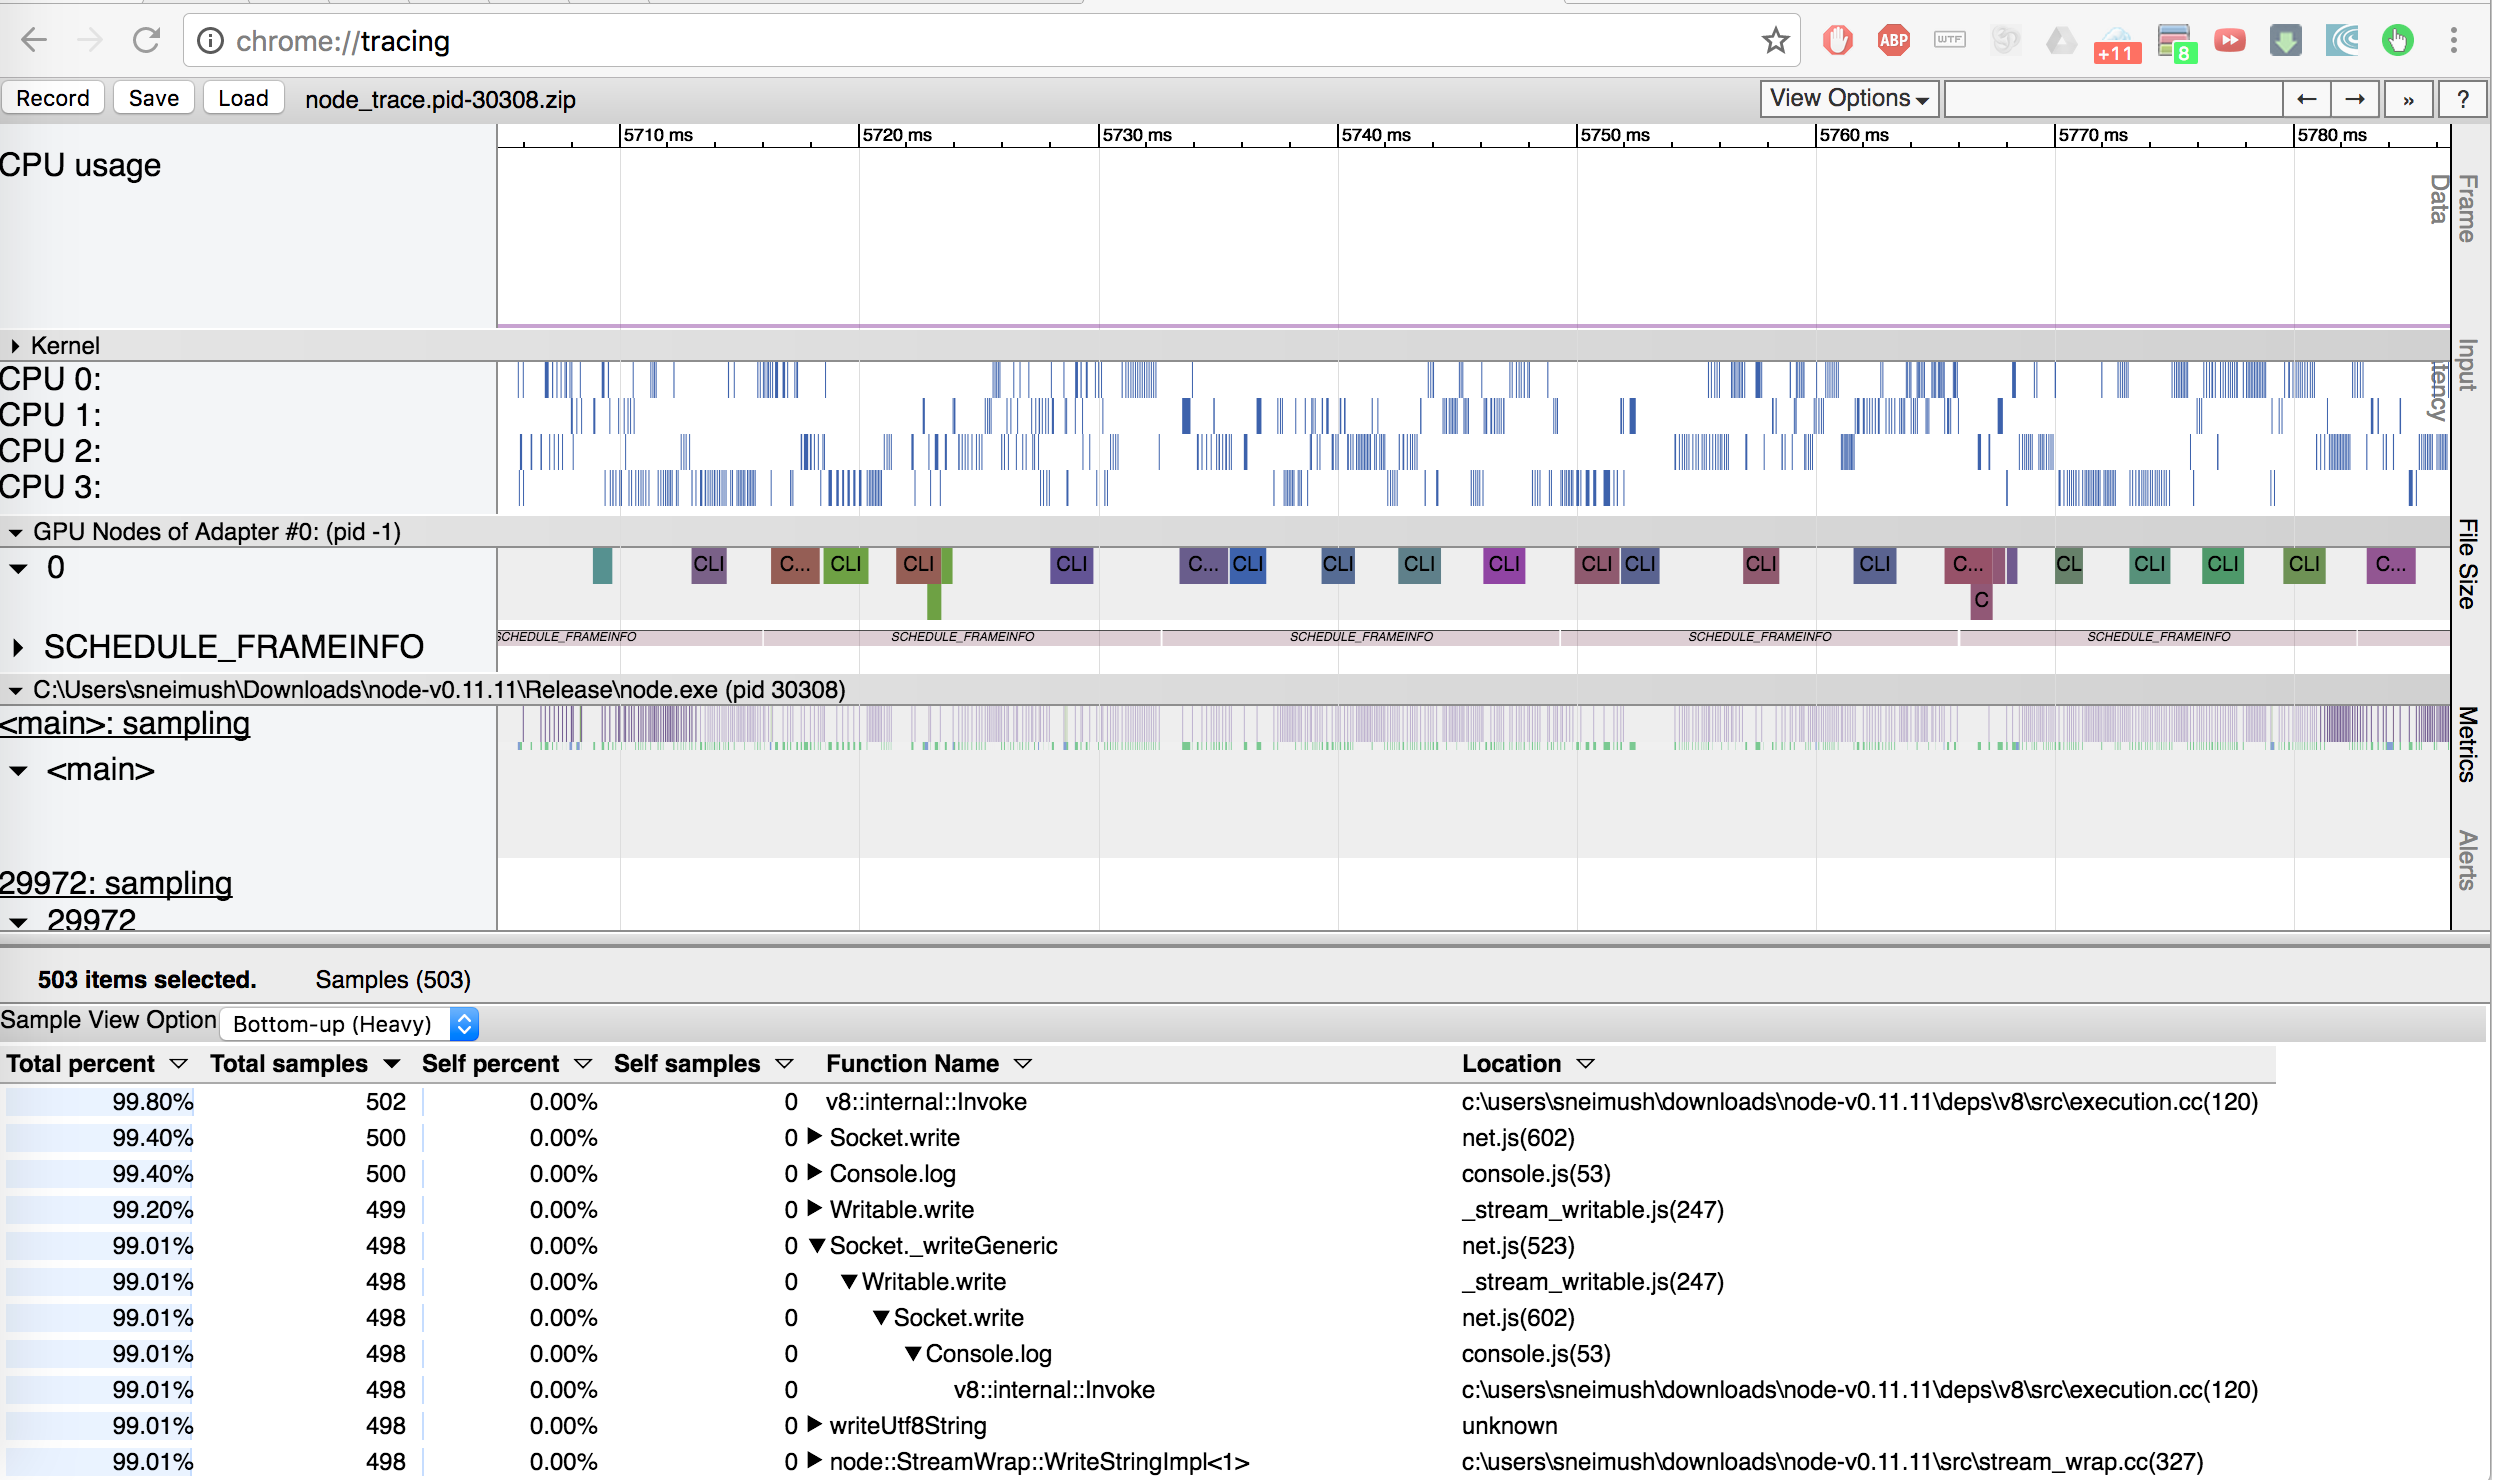
python sea_runtool.py -b ..\build_win\bin -o path_where_to_put_the_trace -f gt --stacks ! node_source\node.exe your_script.jsYou will get the trace:
Special thanks to Sergey Neimushchev for enabling of node.js profiling in Intel® Single Event API!