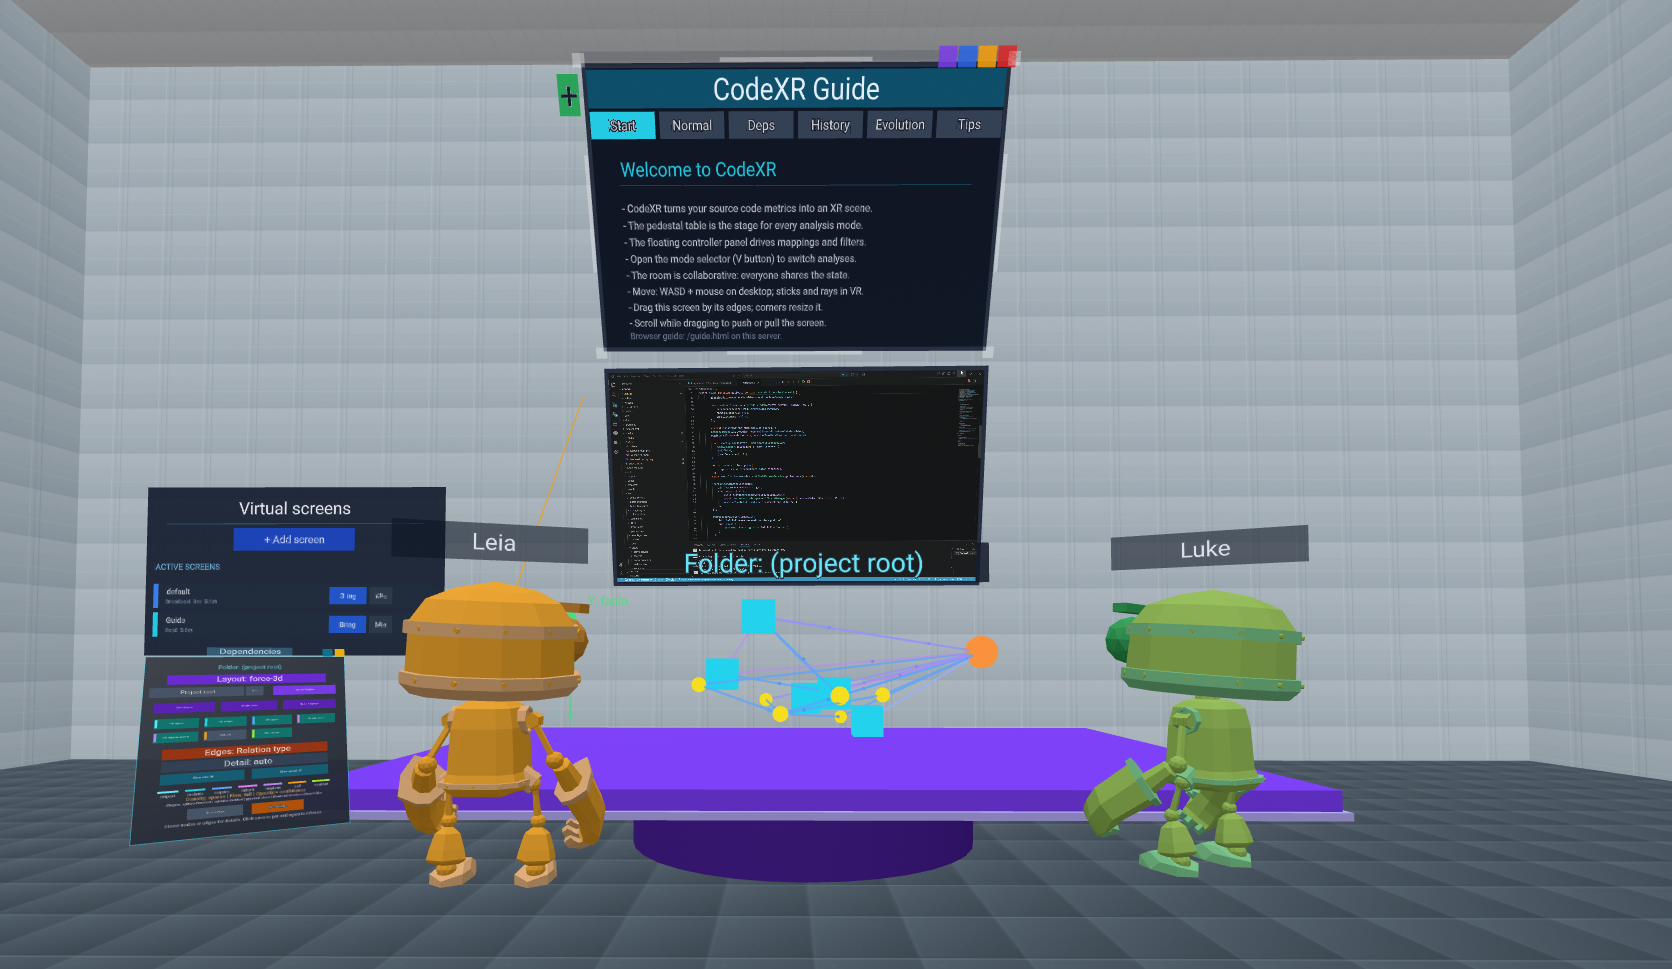
CodeXR is a Visual Studio Code extension that analyzes your code (complexity, size, structure, dependencies, history) and turns the numbers into something you can actually look at: a 3D scene served locally and opened in the browser you already have. Walk around your codebase like a city, watch it update live as you edit, compare two points of its Git history side by side, or replay its whole evolution as a film.
No VR headset required. Everything works on a normal desktop with mouse and keyboard, and the 2D LivePanel mode doesn't even leave VS Code. If you do have a headset, the same scene becomes immersive. That's the XR in CodeXR: an extra dimension when you want it, never a requirement.
Everything runs on your machine: local analysis, local servers, no telemetry, no account, and nothing is downloaded without asking you first (your answer is remembered, so you are asked once).














CodeXR is the artifact behind "Real-Time XR Visualizations of Code Metrics in the IDE" by David Moreno-Lumbreras, Gregorio Robles and Adrián Montes Linares, a paper accepted and presented at VISSOFT 2025, the IEEE Working Conference on Software Visualization, co-located with ICSME 2025.
The artifact received the conference's Distinguished Artifact Award.
| Paper | IEEE Xplore · DOI 10.1109/VISSOFT67405.2025.00034 |
| Award | Official announcement · Certificate |
If CodeXR is useful in your own research, citing the paper above is the best way to support it.
Visit our comprehensive documentation website: https://code-xr.adrianmonteslinares.com/
Our official documentation includes:
- Complete Installation Guide - Step-by-step setup instructions
- Interactive Tutorials - Hands-on learning experiences
- API Reference - Detailed technical documentation
- Video Guides - Visual walkthroughs of key features
- Troubleshooting - Solutions to common issues
- Advanced Configuration - Customization options and settings
You can also access the documentation directly from VS Code through the CodeXR tree view → "Learn More" section.
If you only have time for one thing, watch the complete tutorial: the whole extension in twelve minutes, from the VS Code sidebar to the four analyses inside the XR room.
Not on toy fixtures. These are silent walkthroughs of the four analyses on three real, public codebases, the same three used to test every release.
BabiaXR (aframe-babia-components), the A-Frame library CodeXR renders its charts with, so the code being measured is the code drawing the scene. Watch the walkthrough
Express (expressjs/express), a small core with a very long history, which makes fan-in obvious and the evolution movie long. Watch the walkthrough
JetUML (prmr/JetUML), a Java desktop application whose deliberate package layering is exactly what the dependency graph is for. Watch the walkthrough
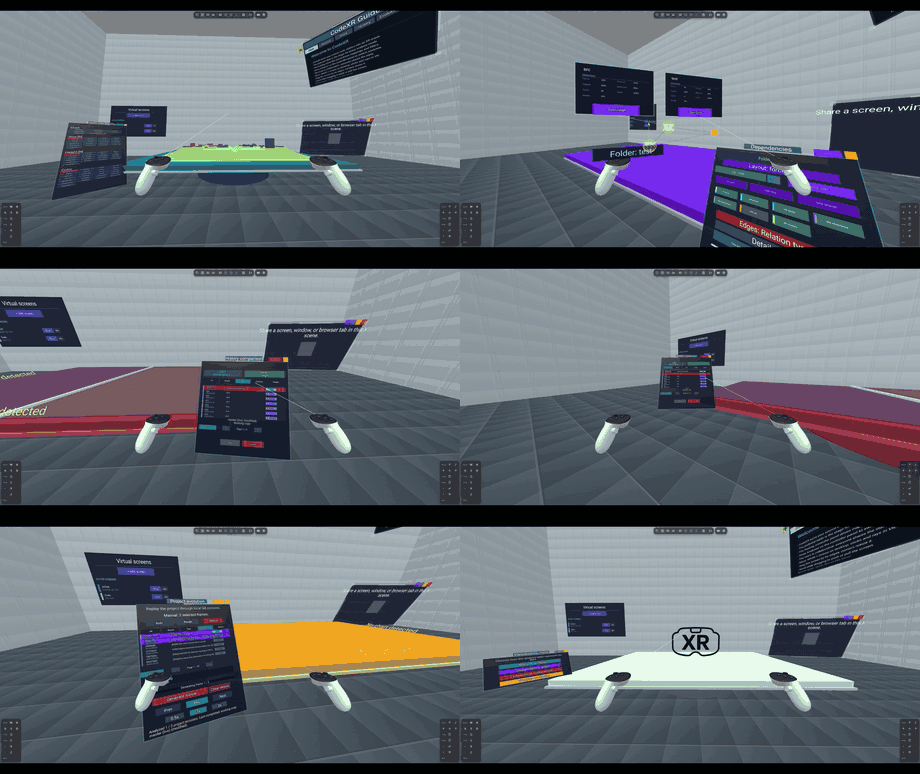
Every video on the channel, with its GIF and duration, is listed in media/v1.2.0/videos/VIDEOS.md.
Threads are the new dependency graph: the lines that tie your codebase together. Timelines are the two Git analyses: compare two points in your project's history, or replay the whole thing as a film. Global Networks are the sessions you can now open to someone who is not on your network at all.
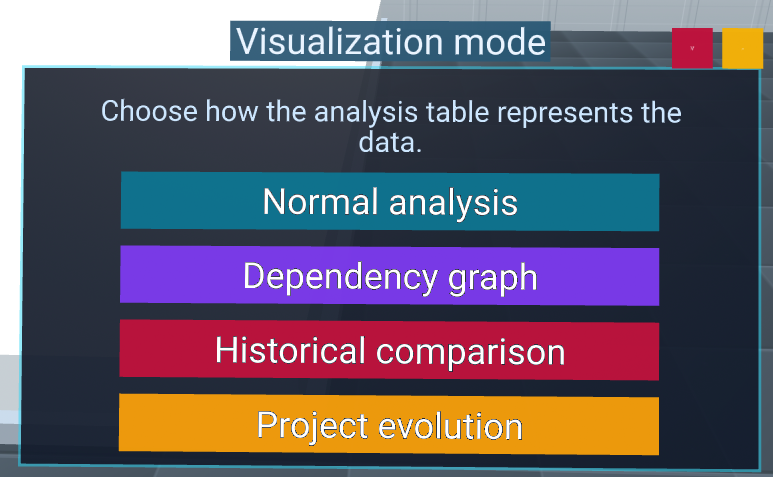
One analysis table now serves four analyses, and you switch between them from inside the scene without losing the state of any of them.
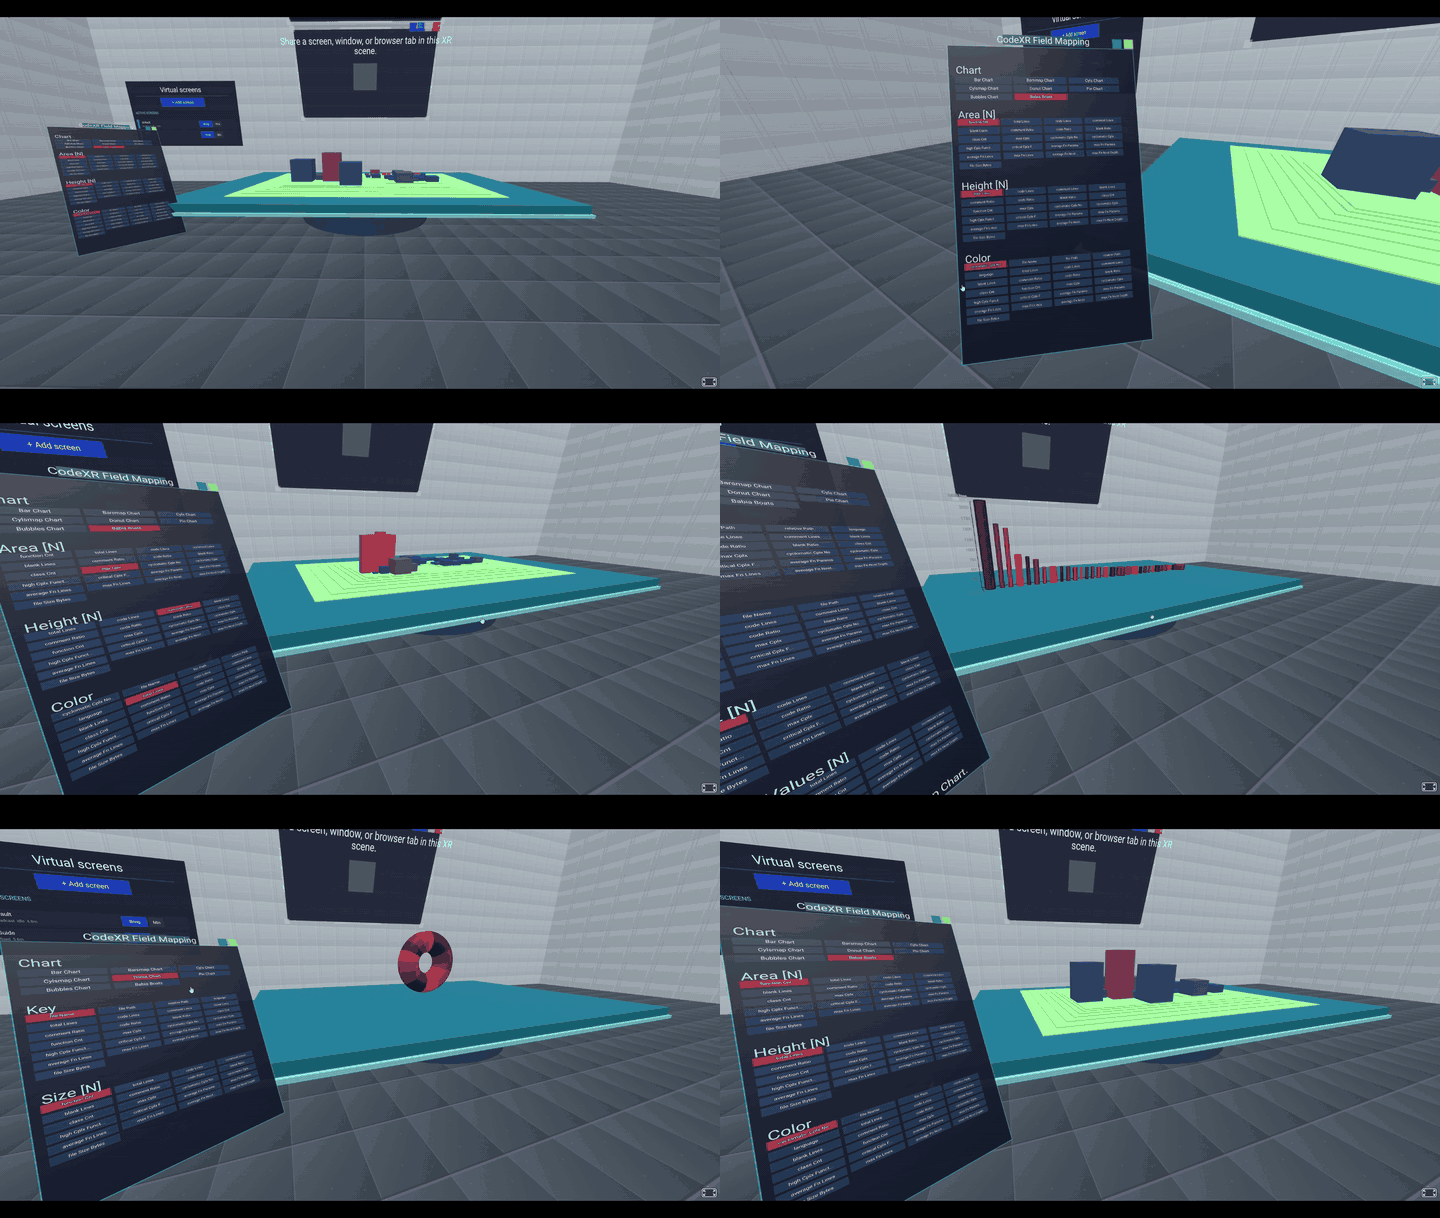
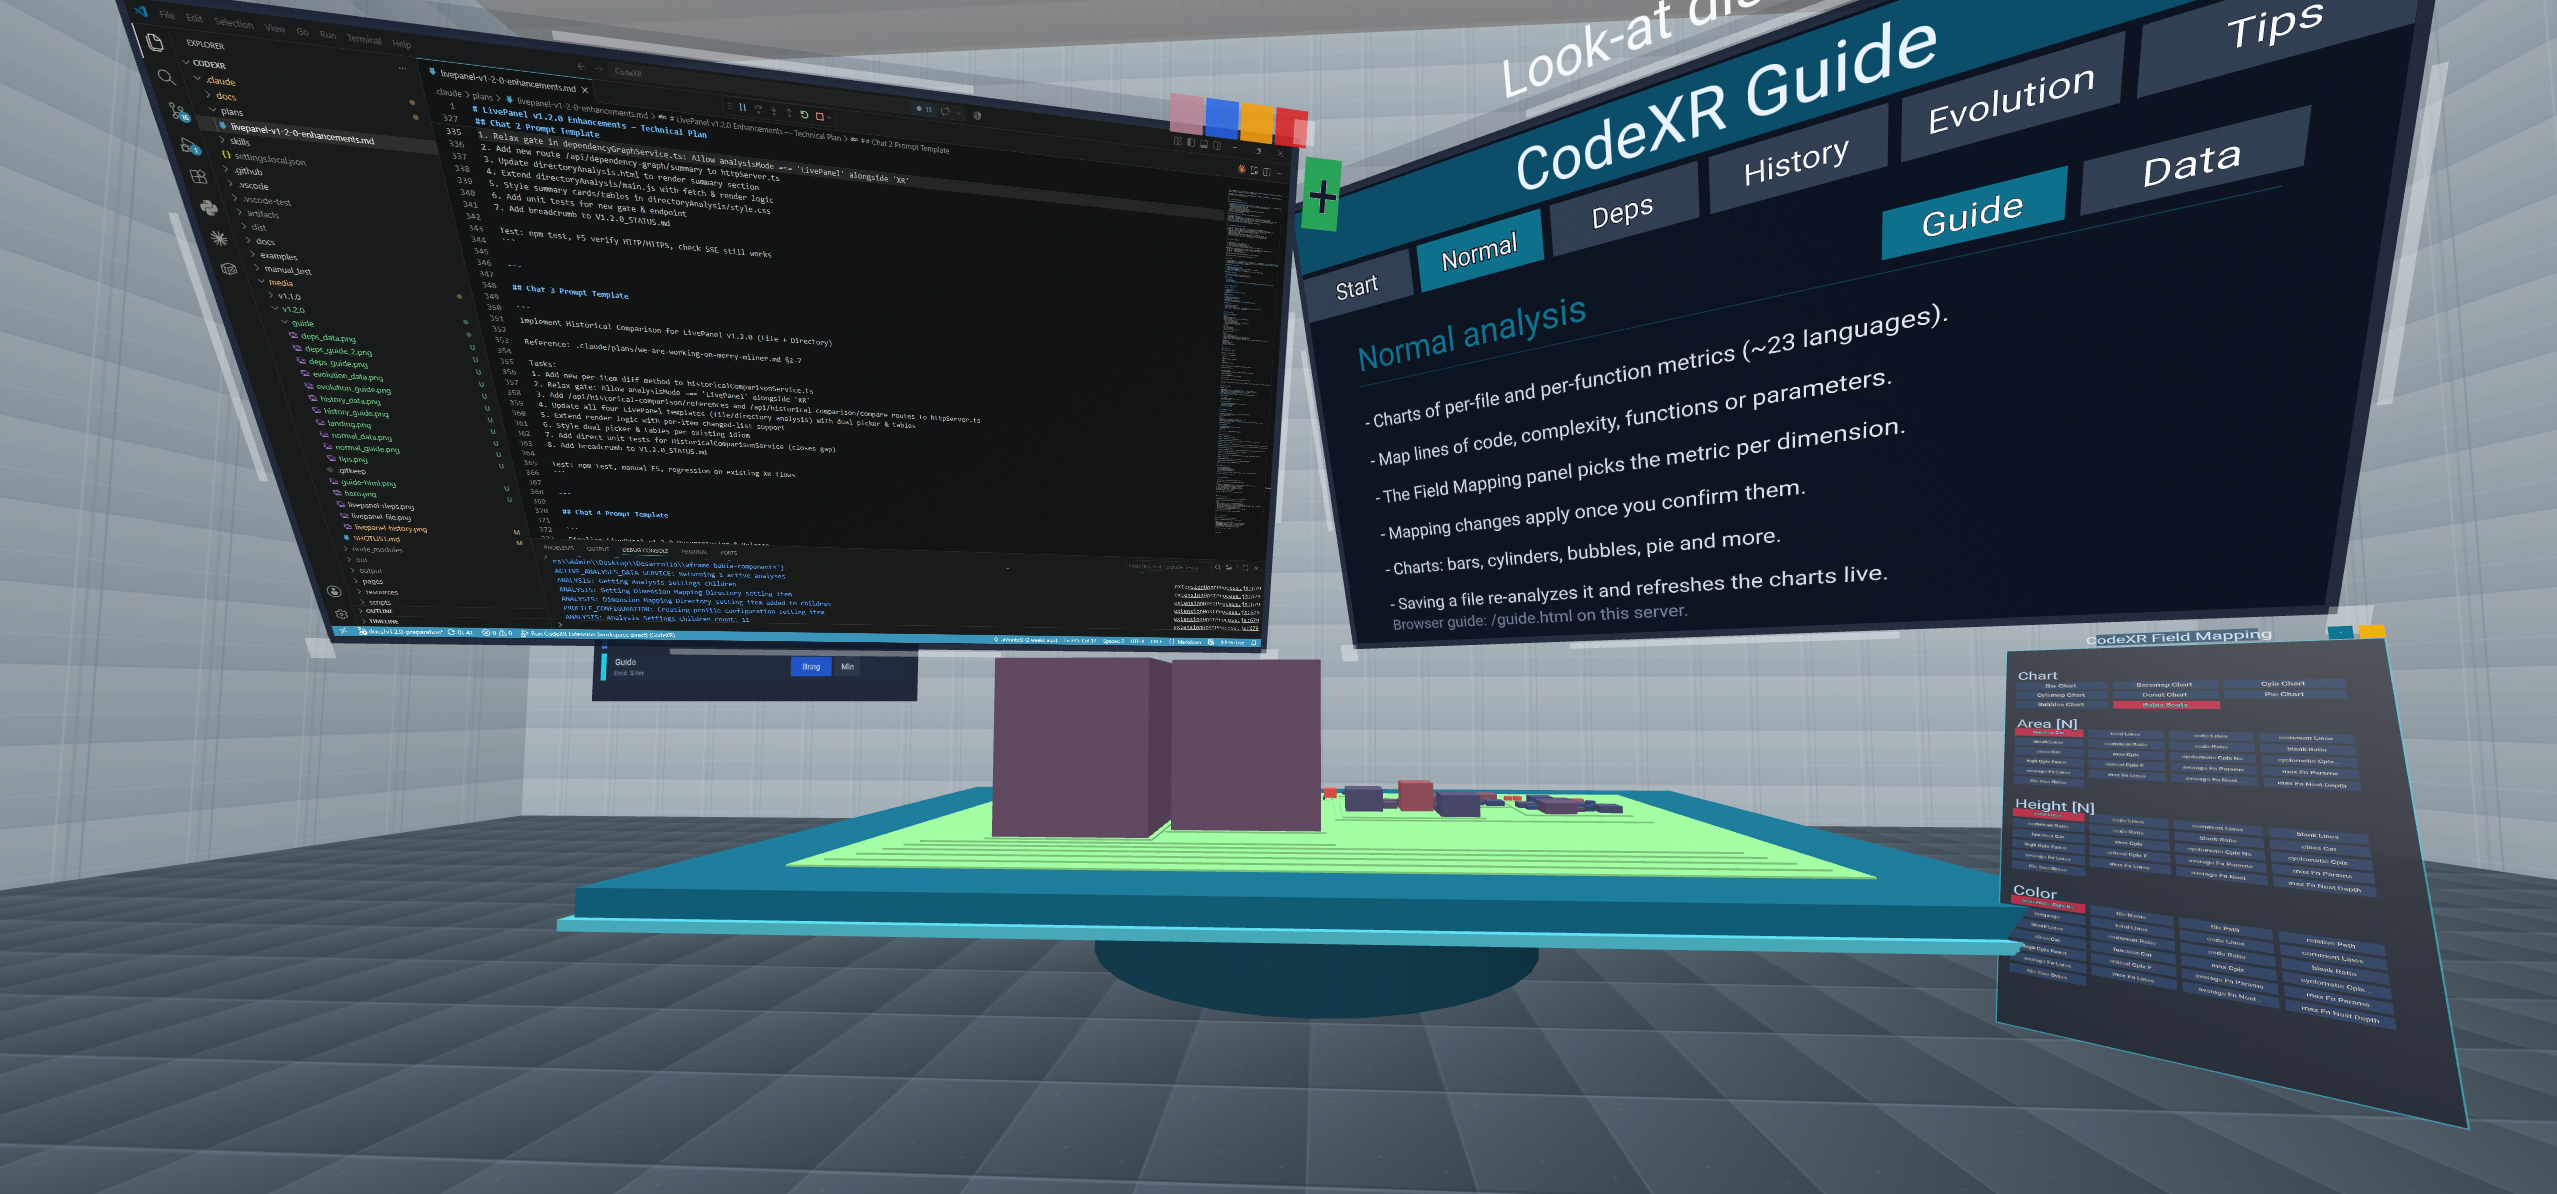
The city you know, now on a rebuilt table: one building per file, sized and coloured by the metrics you choose. Every chart type (bars, cylinders, pie, donut, bubbles, boats and more) now presents correctly and can be changed live from the Field Mapping panel, big projects stay readable by showing the top files per metric, and any change you save in the editor updates the scene by itself.
 |
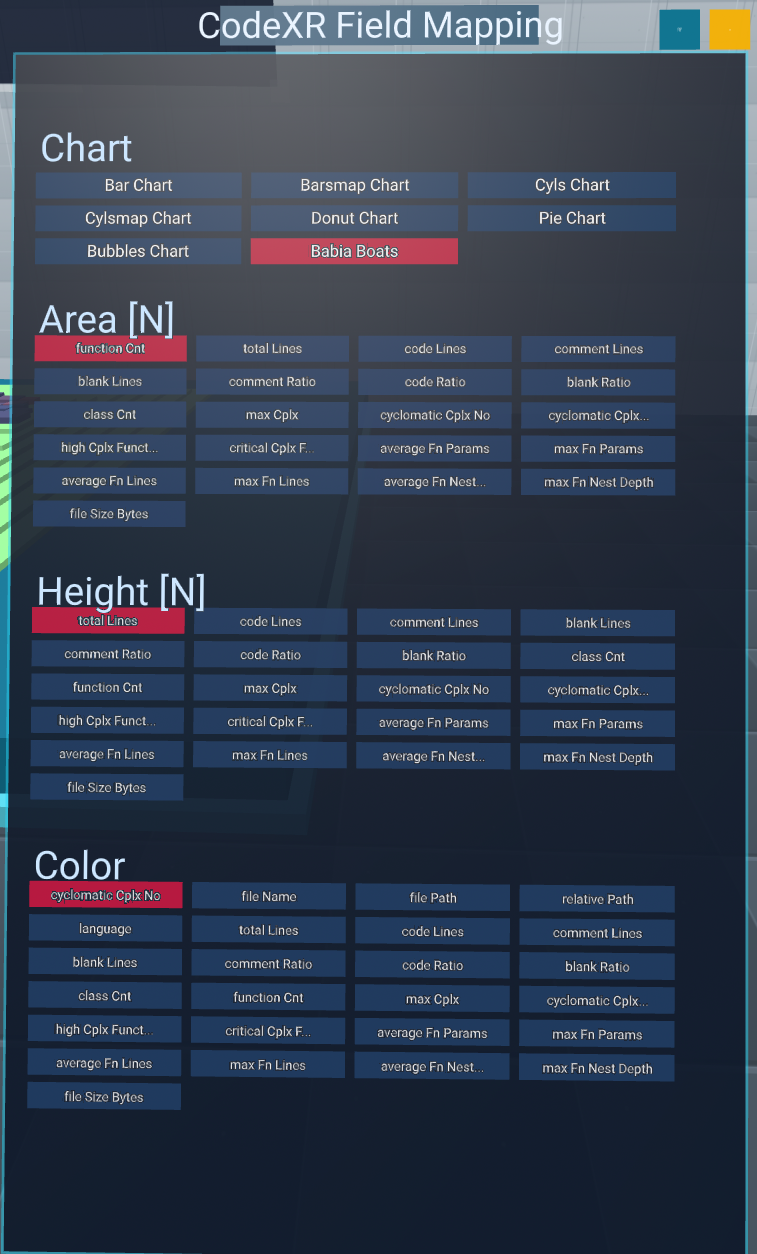 |
| The result: the city on its table, with the guide and your editor around it | The panel: pick the chart, then the metric that drives area, height and colour |
▶ Watch the full demo on YouTube
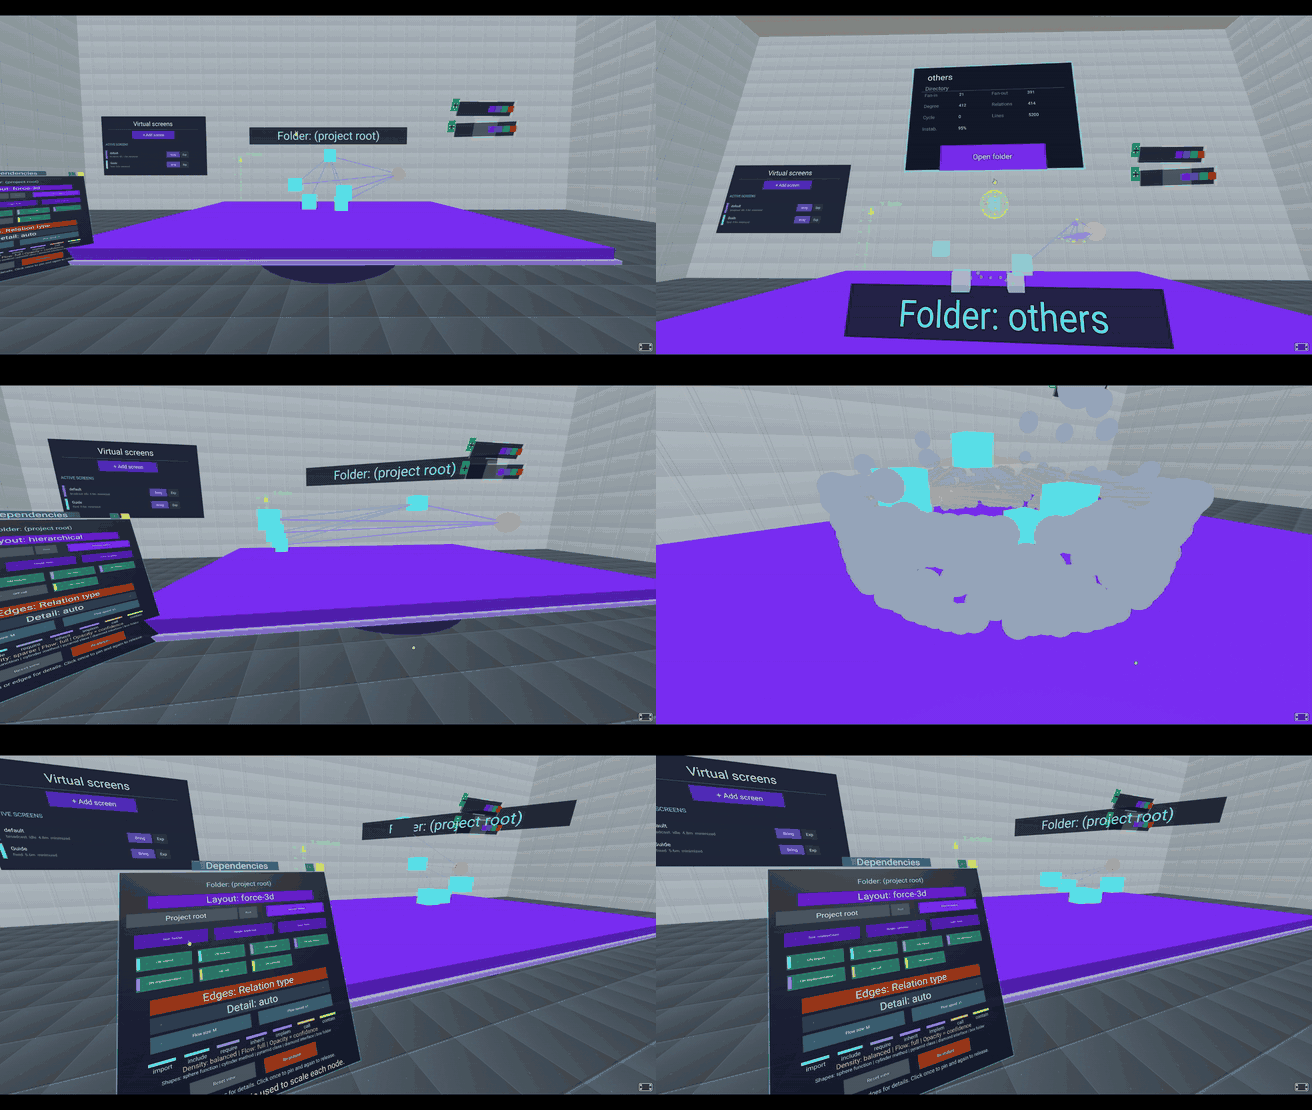
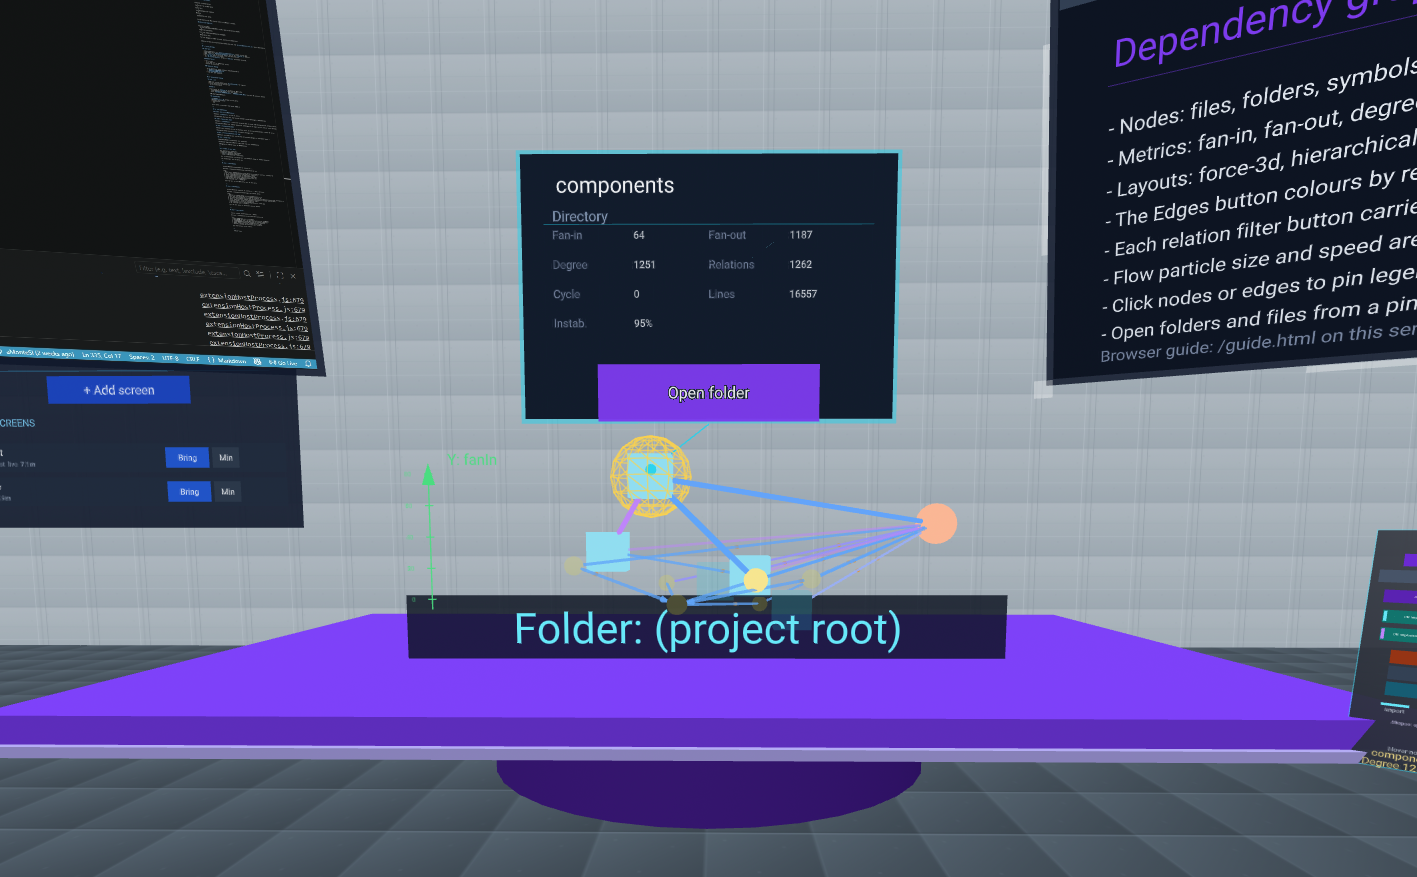
A new analysis that answers what depends on what, and what happens if I touch this. Relations are extracted statically from your working directory across the supported languages, and rendered as a navigable 3D graph with three layouts: force-3d, hierarchical and metric-space with real axes. Any node metric (fan-in, fan-out, cycle size, blast radius…) can drive size, height, colour or position, so "the thing that breaks the most if you touch it" becomes something you see across the room. Click a node to pin its metric card; large projects open in group view and you drill in.
 |
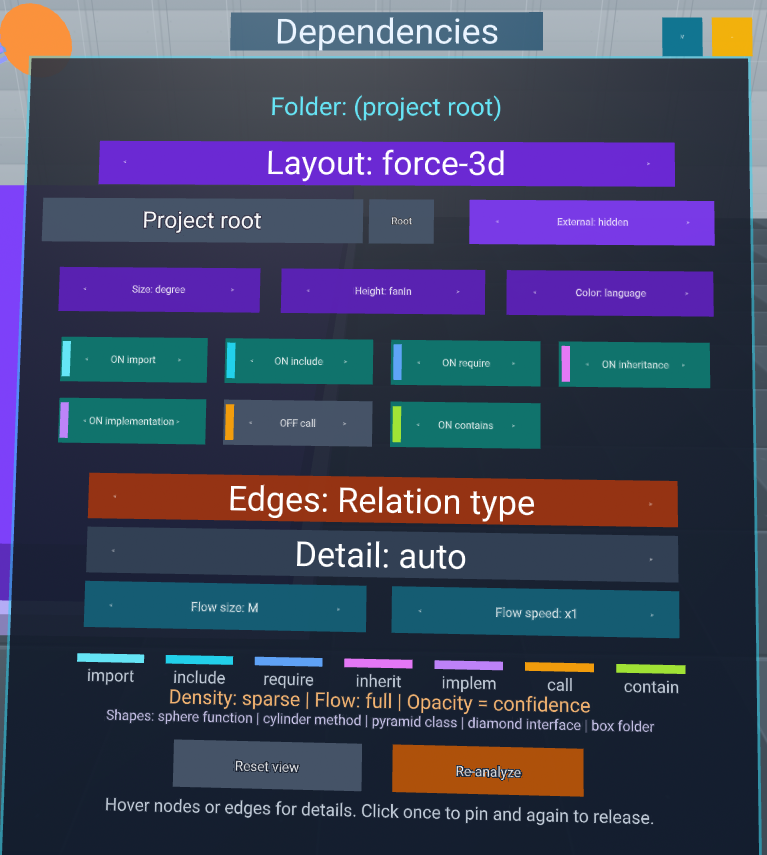 |
| The result: pin a node and read its coupling, its cycle and its blast radius | The panel: choose the layout, map the metrics and filter which relations are drawn |
▶ Watch the full demo on YouTube
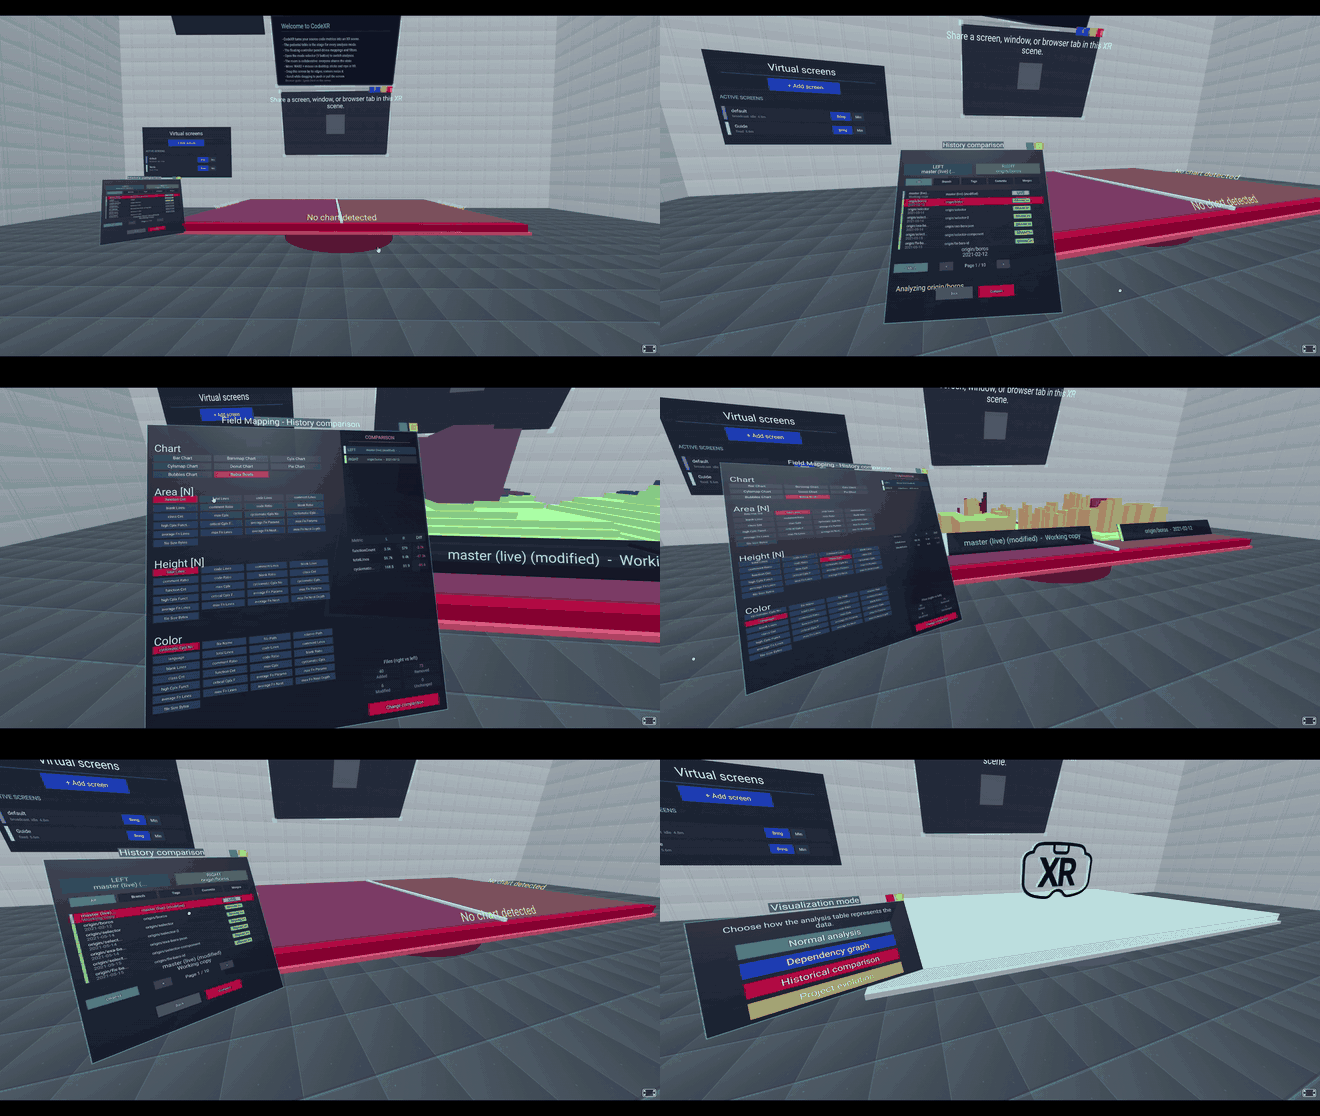
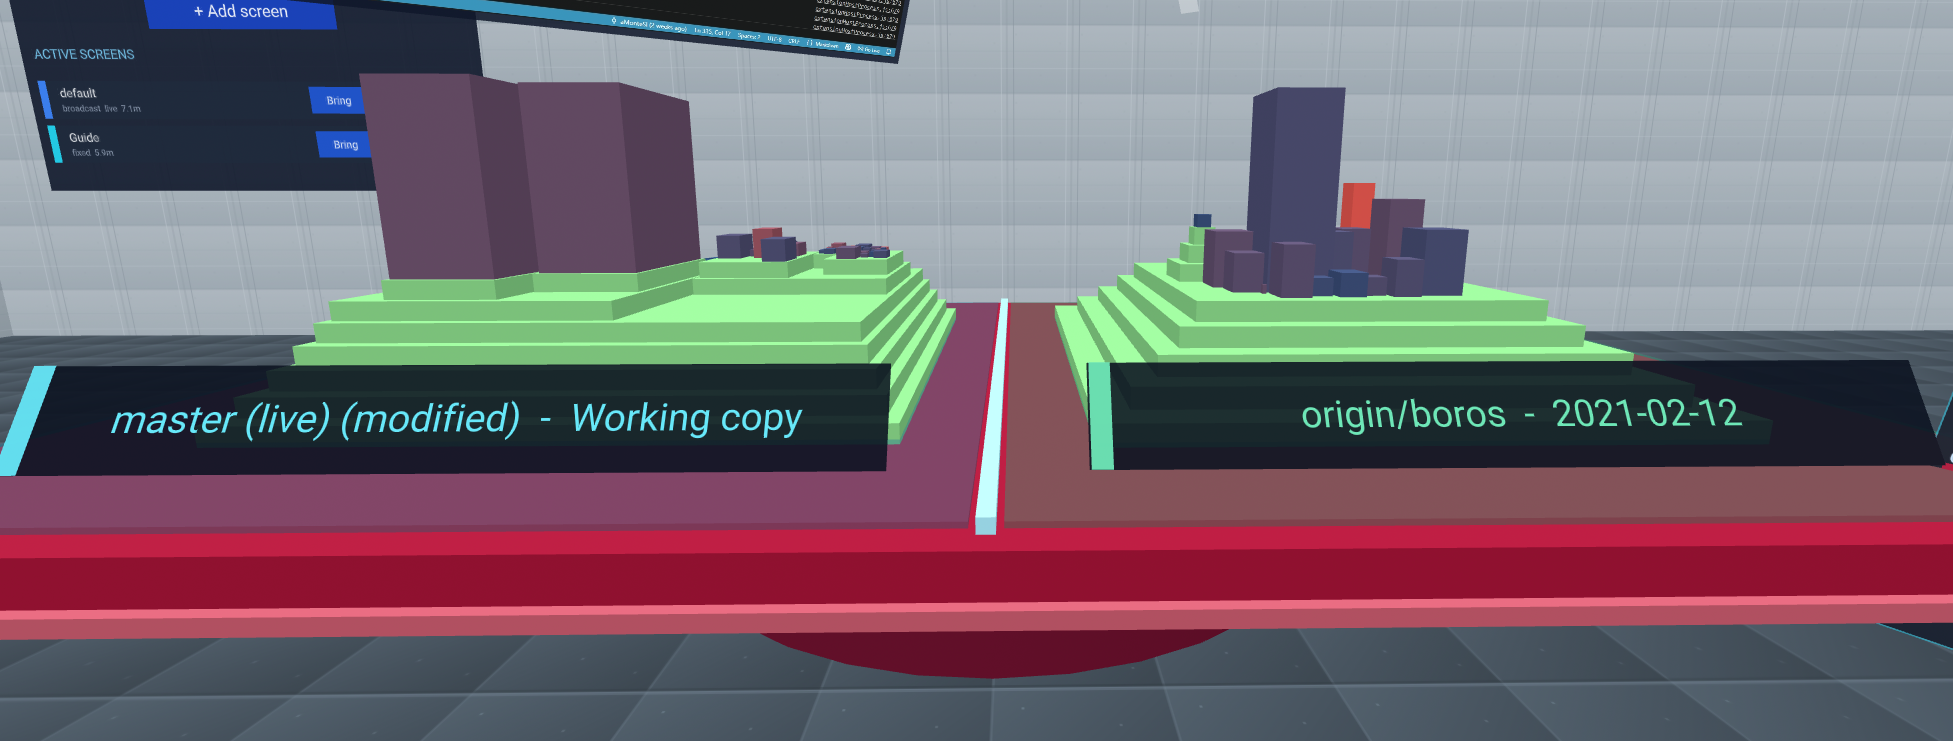
Pick two sources (working copy, branch, tag or commit) and CodeXR puts both states on one dual table, same chart, same mapping, same scale, so a height difference is a real difference. A comparison card reports added / removed / modified counts and per-metric deltas. It never runs checkout or fetch and never writes inside .git: your branch, index and files stay exactly where you left them.
 |
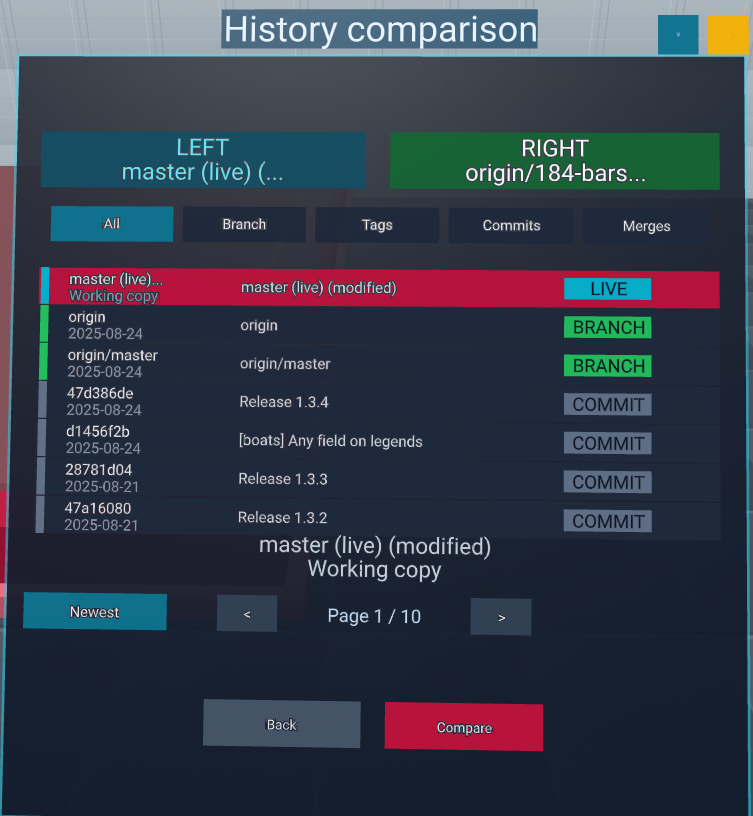 |
| The result: both revisions side by side, each with its own label and date | The panel: choose what goes on the left and on the right, then compare |
▶ Watch the full demo on YouTube
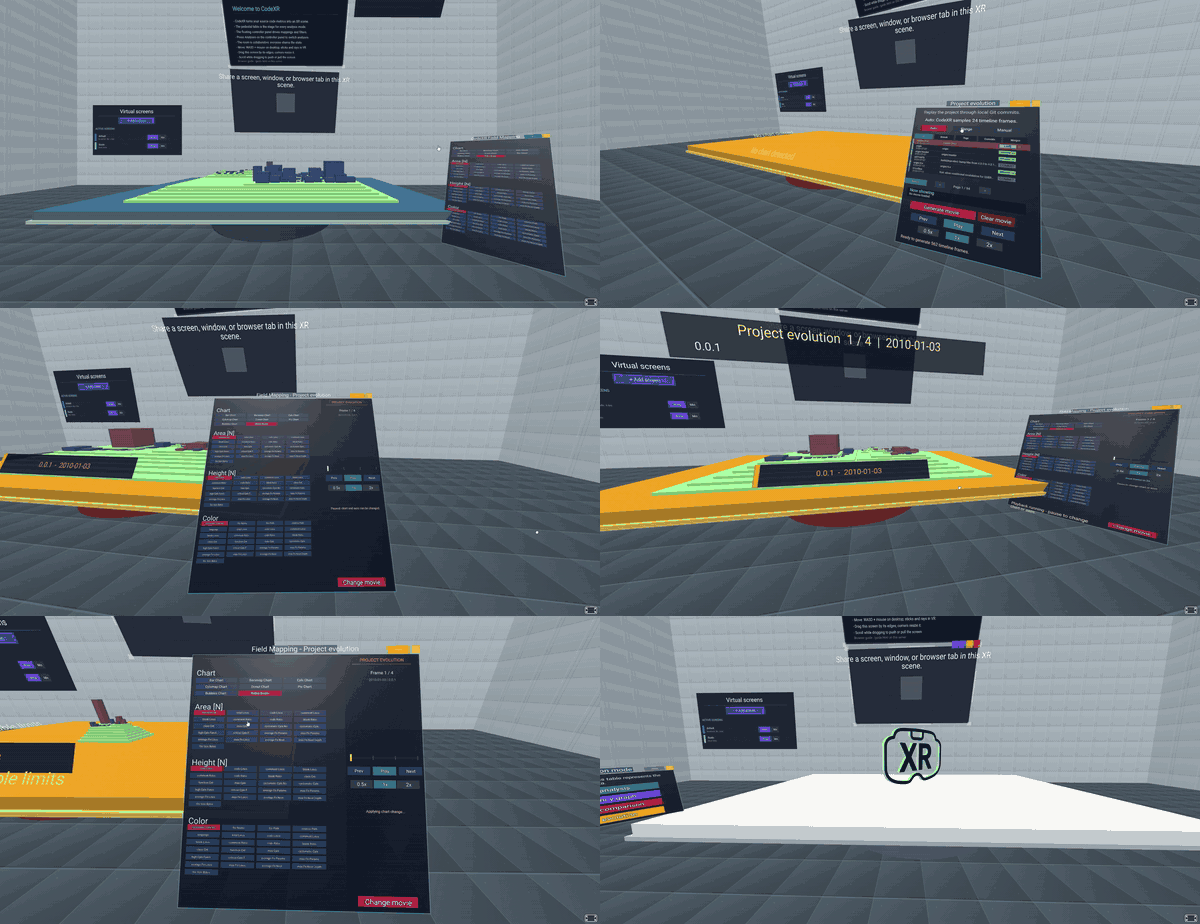
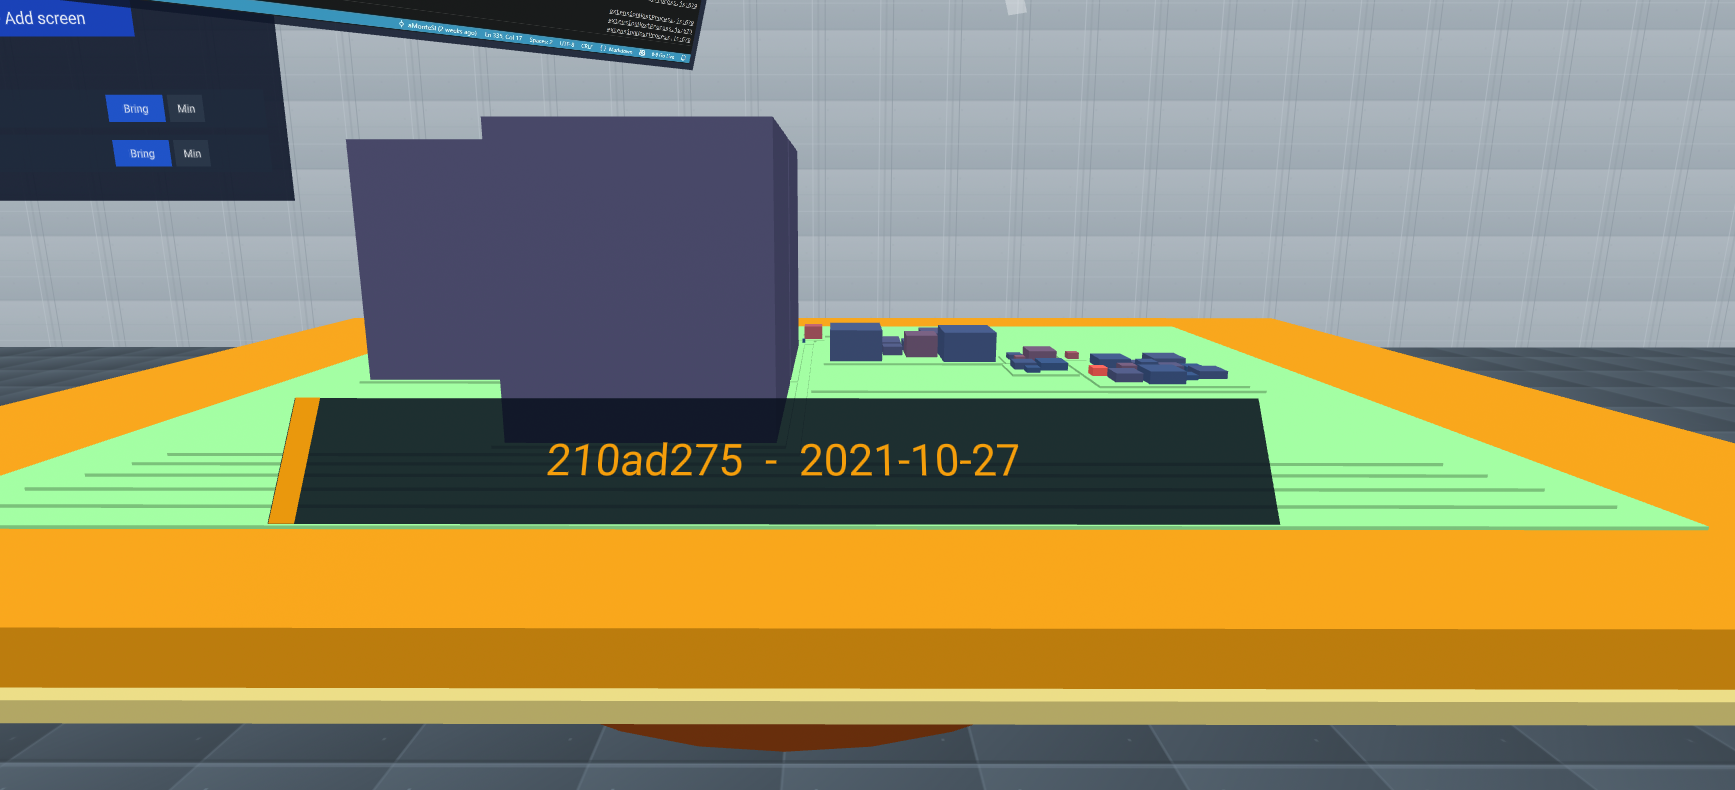
Where the comparison shows two photographs, Project Evolution plays the movie: the chart walks the project's own history, commit by commit, from the first revision to the current state of the branch. The timeline is sampled evenly in time (favouring merges and tags), or you pick a range, or exactly the commits you want. Play, pause, step, change speed, jump anywhere. Every frame is a full analysis, labelled with its commit and date.
 |
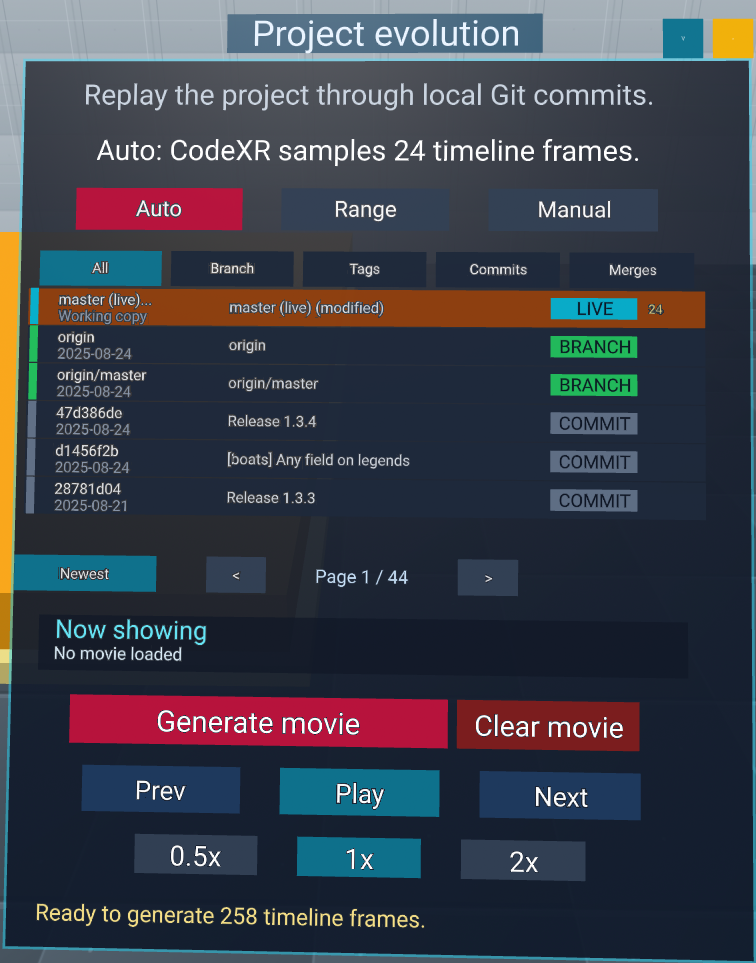 |
| The result: every frame is a real analysis, stamped with its commit and date | The panel: build the timeline, generate the movie, then play, step and change speed |
▶ Watch the full demo on YouTube
- Collaboration 2.0: persistent identities, host/guest roles with automatic promotion, and a bundled animated avatar (CC0, works offline) with a per-participant colour and a name tag that always faces you.
- Cross-network sessions, ready out of the box: every server you start opens an outbound Cloudflare tunnel automatically, so sharing with someone outside your network is one link away: no router changes, no published IP, a six-digit pairing code that burns itself on a wrong attempt, and full revocation the moment you stop sharing. The invitation link stays valid for as long as you keep sharing, and the whole capability can be turned off in Server Configuration.
- Screen sharing that survives the trip: guests arriving through the tunnel are served by your own CodeXR server; one encode for the whole audience, quality that follows the audience size.
- An in-room user guide: six colour-coded tabs plus a 24-term metric glossary generated from the real analysis contracts, also served as
guide.htmlfor reading outside XR. - LivePanel grows two sections: Dependency Summary (counters, top fan-in/fan-out, cycles) and Historical Comparison in 2D with a searchable delta table.
- A reorganized sidebar: servers, collaboration and remote access in one place, readable native dialogs, and the whole UI in English.
- The in-scene analysis selector: a proper
Analysesbutton that wears the colour of the analysis you are in:
The complete list, including a long round of chart, containment and collaboration fixes, is in the CHANGELOG.
A VR session over your own network needs none of this: a headset on the same Wi-Fi opens the scene directly. Cross-network access exists for the other case, someone who is not on your network. It is enabled by default (turn it off in Server Configuration if you prefer): cloudflared opens an outbound tunnel, so your router never has to accept an incoming connection and your IP is never published, and nobody enters without the code you read out.
The whole point of the flow below is that a link alone is never enough to get in. Whoever opens it still has to receive a code from you, through a channel you already trust.
Two people are involved, and each step below says which one acts: the host runs the analysis in VS Code and owns the session, and the guest joins from a browser anywhere in the world.
Cross-network connections are enabled by default, so when your analysis server starts, CodeXR opens the tunnel with it (the first time it will offer to download cloudflared, once). The sidebar shows the Cross-network address, the trycloudflare.com invitation link, which also lands on your clipboard; the link stays valid for as long as you keep sharing. If you stopped the connection, Start remote access on the server row brings it back. Send the link to your guest however you normally talk to them.
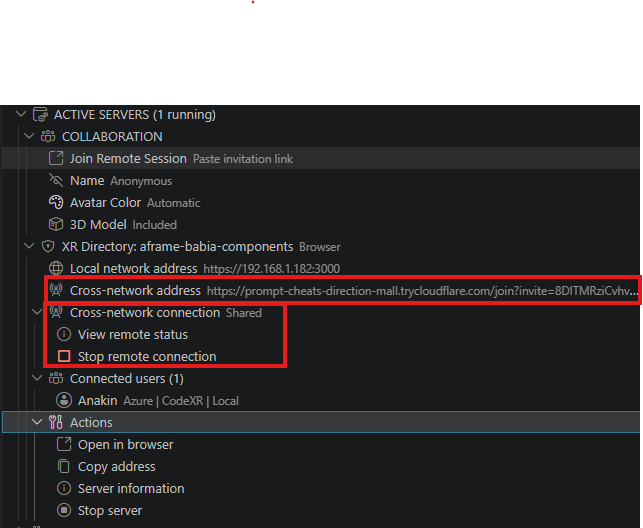
Right below it sit View remote status and Stop remote connection, and further down the list of connected users, so the whole session lives in one place.
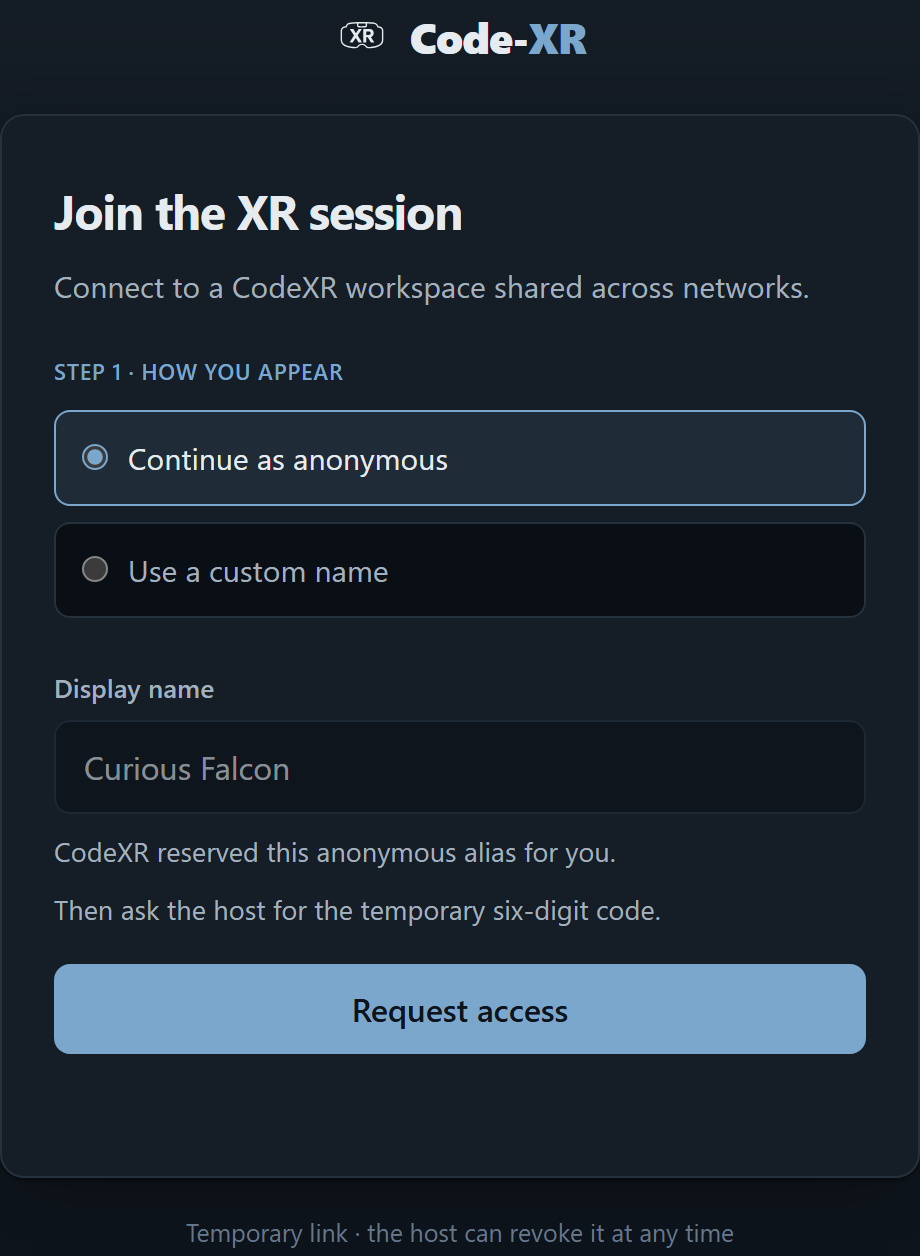
The link opens this page. Continue as anonymous, with an alias CodeXR reserves for you, or type a custom name of 2 to 32 characters. Then press Request access, which puts you in the waiting room: no code, no entry.
 |
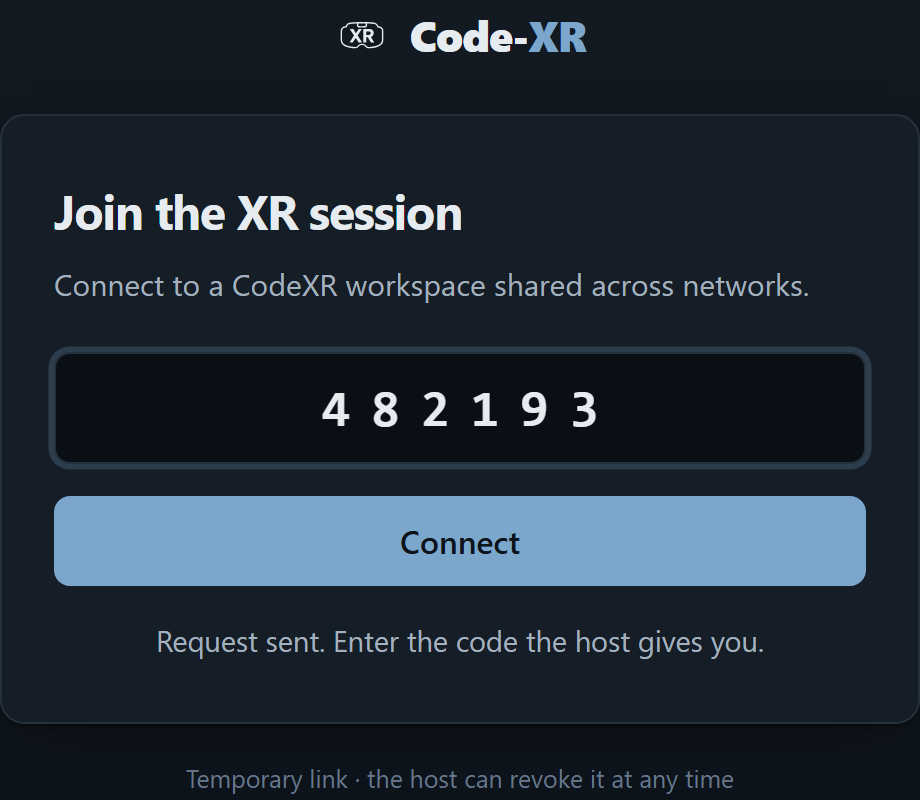 |
| Step 1: how you appear in the room | Step 2: waiting for the code the host reads out |
The moment the guest requests access, VS Code shows you the code with a Copy code button:
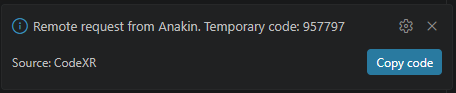
The sidebar reflects the same thing, so a dismissed notification is never a dead end: the connection row reads 1 request waiting and a Generate new pairing code action appears next to it.
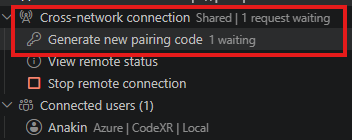
Pass those six digits to your guest through whatever channel you already use, a call or a message. Guest: type them, press Connect, and you are in the session.
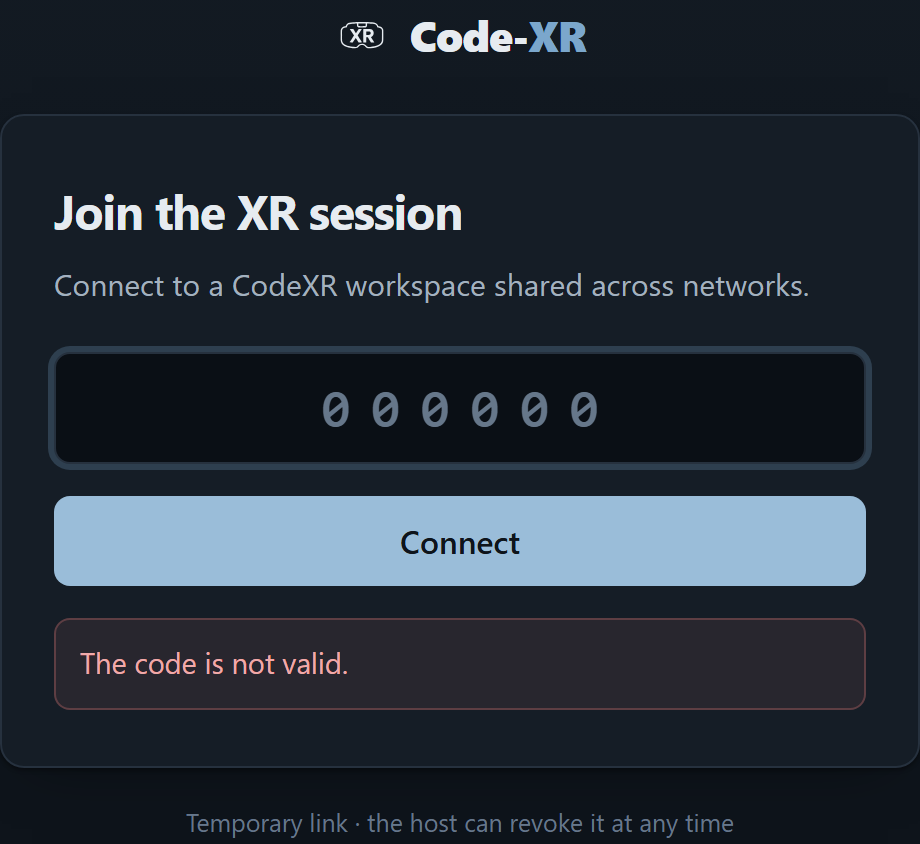
A wrong code is burnt immediately on the server, so it can never be retried. The host gets a warning naming the guest and their address, with a Generate new code button that mints a fresh one on the spot, and the same Generate new pairing code action stays in the sidebar. There is no limit to how many times you can do this. If instead the guest runs out of attempts, the pairing request itself is over and they need a brand new invitation link.
 |
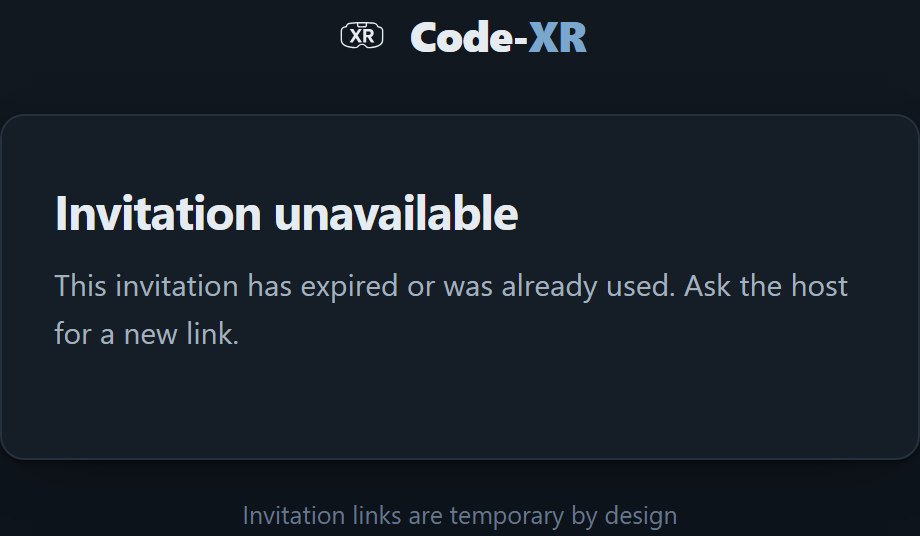 |
| A burnt code: the guest is told to ask for a new one | A dead link: expired or already used, so it needs a new invitation |
Connected users lists everyone in the session, and each row states how they got there, so a guest who came through the tunnel is never confused with someone on your own network:
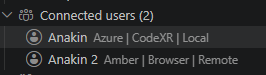
Click any of them to open their card: display name, role, avatar, when they connected, whether they arrived through the tunnel or from your local network, and the IP address they connected from. Guests carry a Remove from Session action; the host cannot be removed.
Removing a remote guest also revokes their session, so the link they have stops working and they need both a new invitation and a new code to come back. Someone on your local network can still reopen the server address, since nothing is gating that beyond the server itself, so stop the server if that is what you want. Either way the person sees a message telling them they were removed rather than the session dying on them.
Stop remote connection ends everything at once: invitations, sessions and credentials are revoked, and the random trycloudflare.com address simply stops existing.
The tunnel is a Cloudflare Quick Tunnel: free, no account, and explicitly best effort. It has no SLA, it does not support Server-Sent Events, and the address changes every time.
cloudflaredis pinned to version 2026.5.2, downloaded only with your consent and checked against its SHA-256 before it ever runs. The full picture is in the cross-network access document.
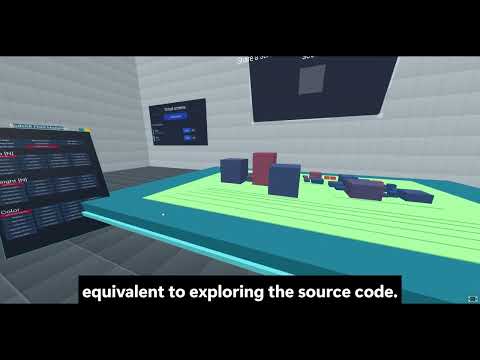
Four narrated videos, one per analysis:
 |
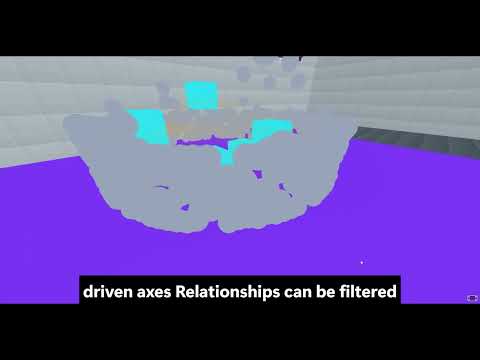 |
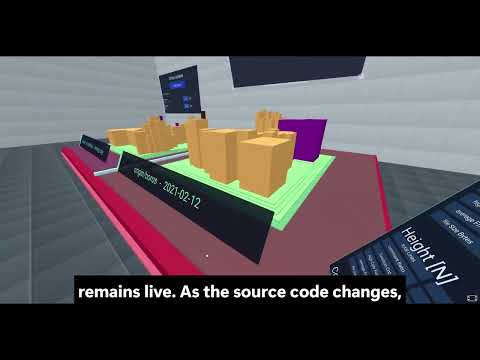
| Classic analysis: the 3D city, Field Mapping and live updates | Dependency graph: layouts, node cards, filters and flow |
 |
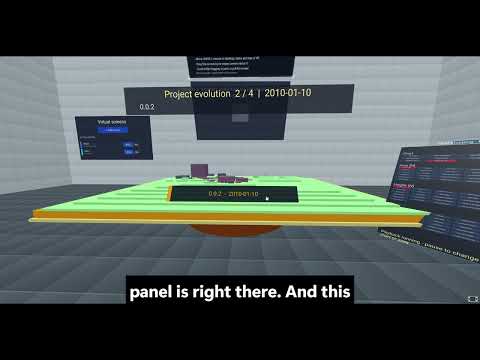 |
| Historical comparison: two revisions, one table | Project Evolution: your repository as a film |
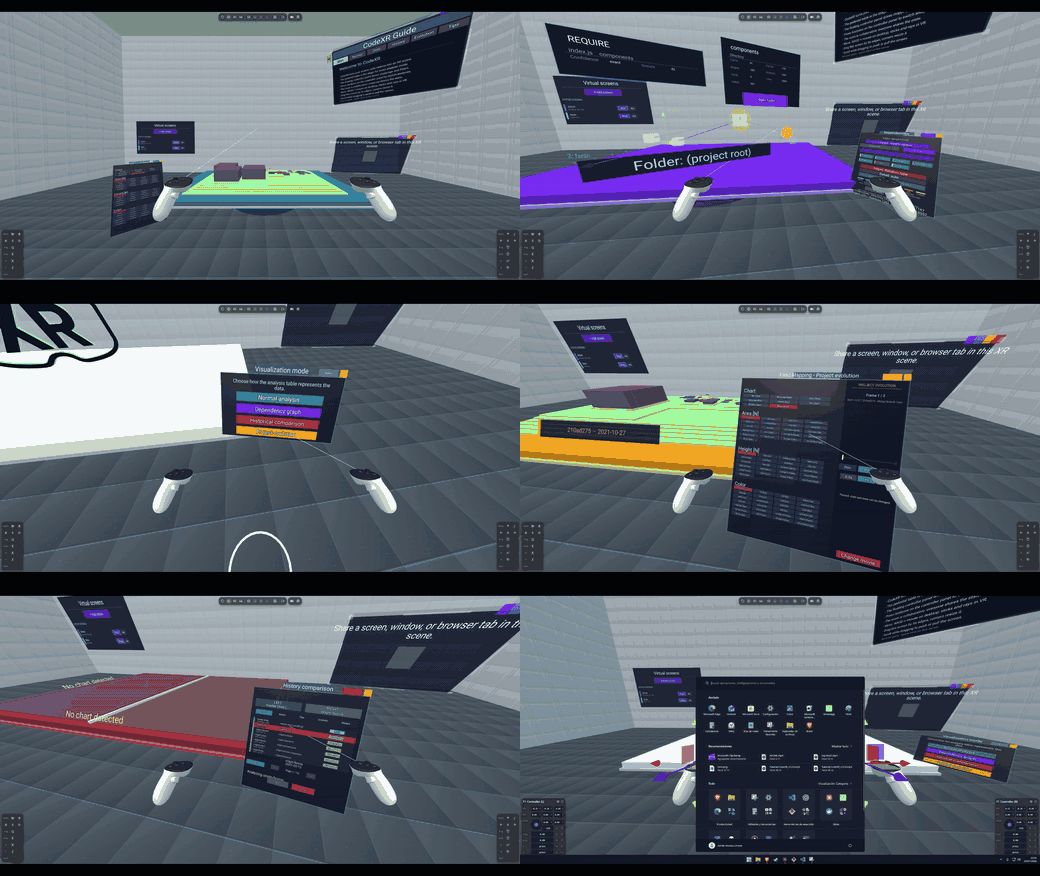
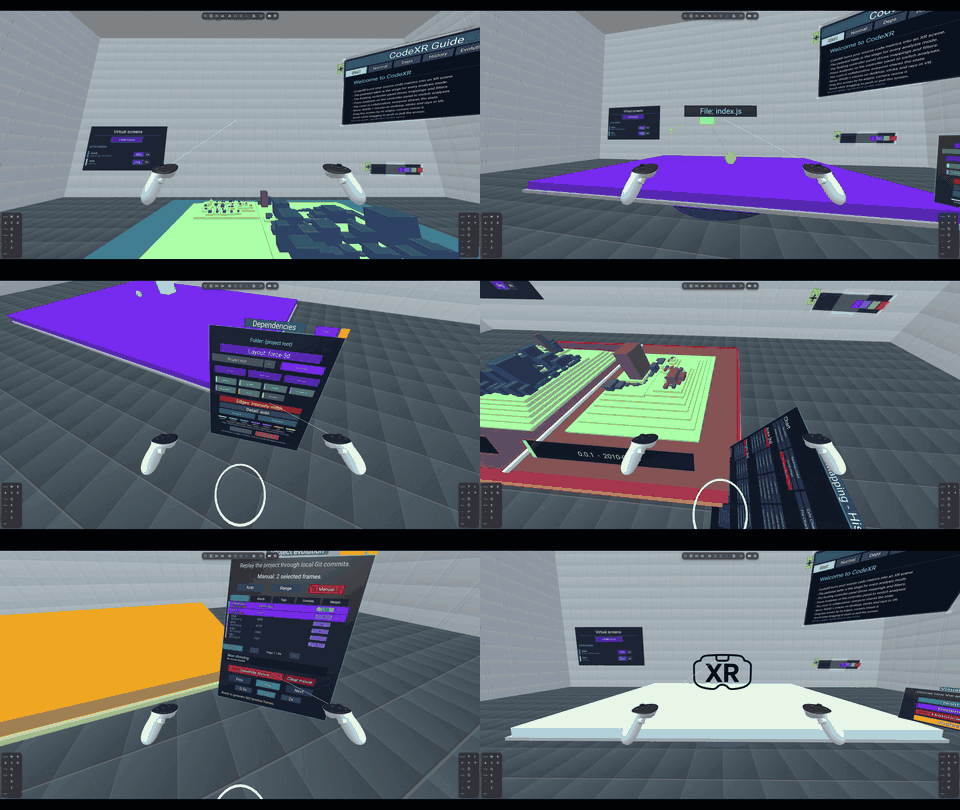
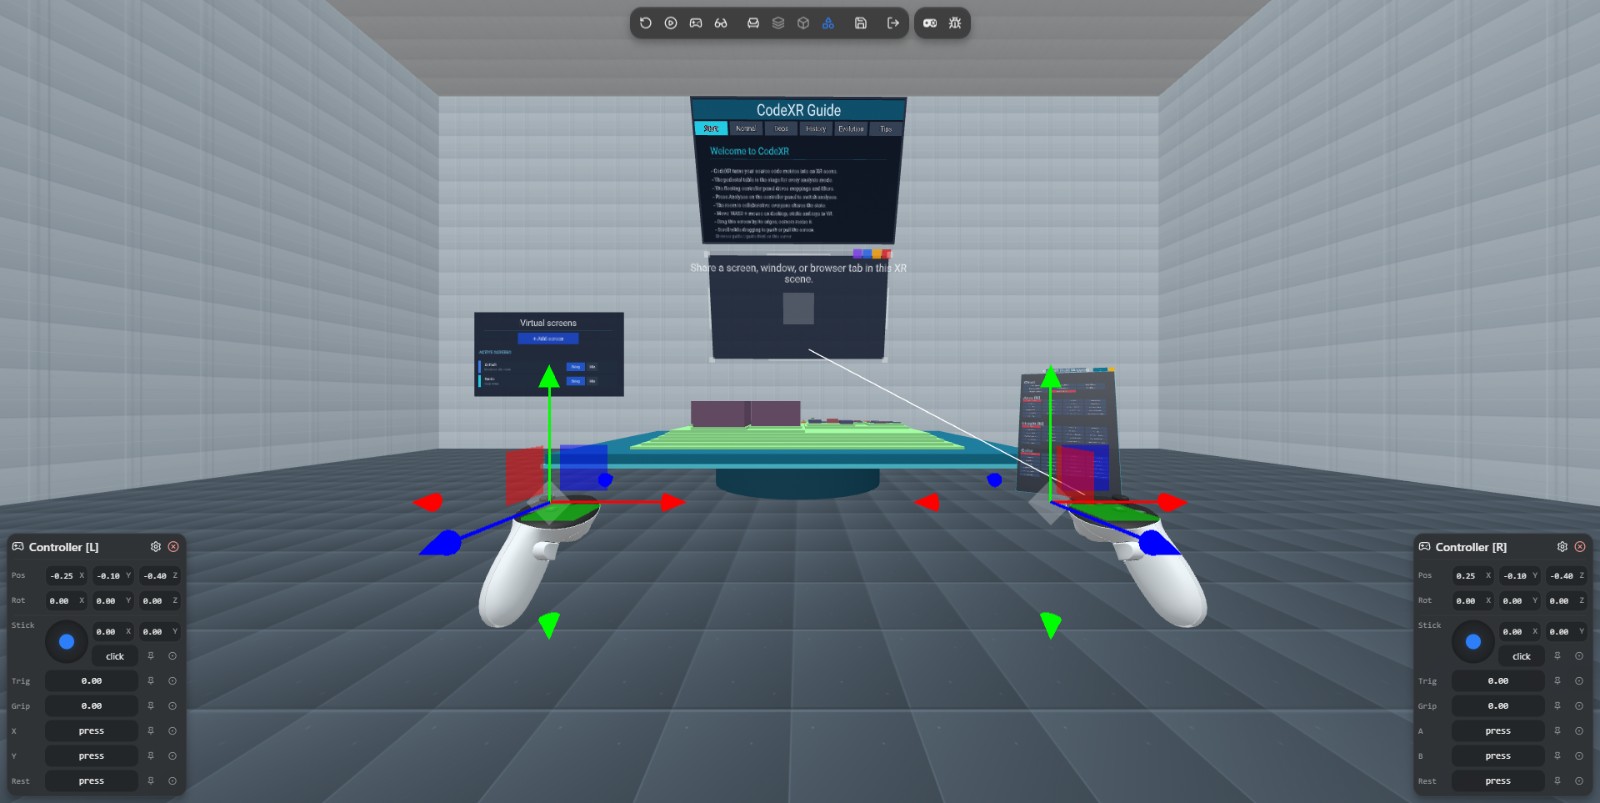
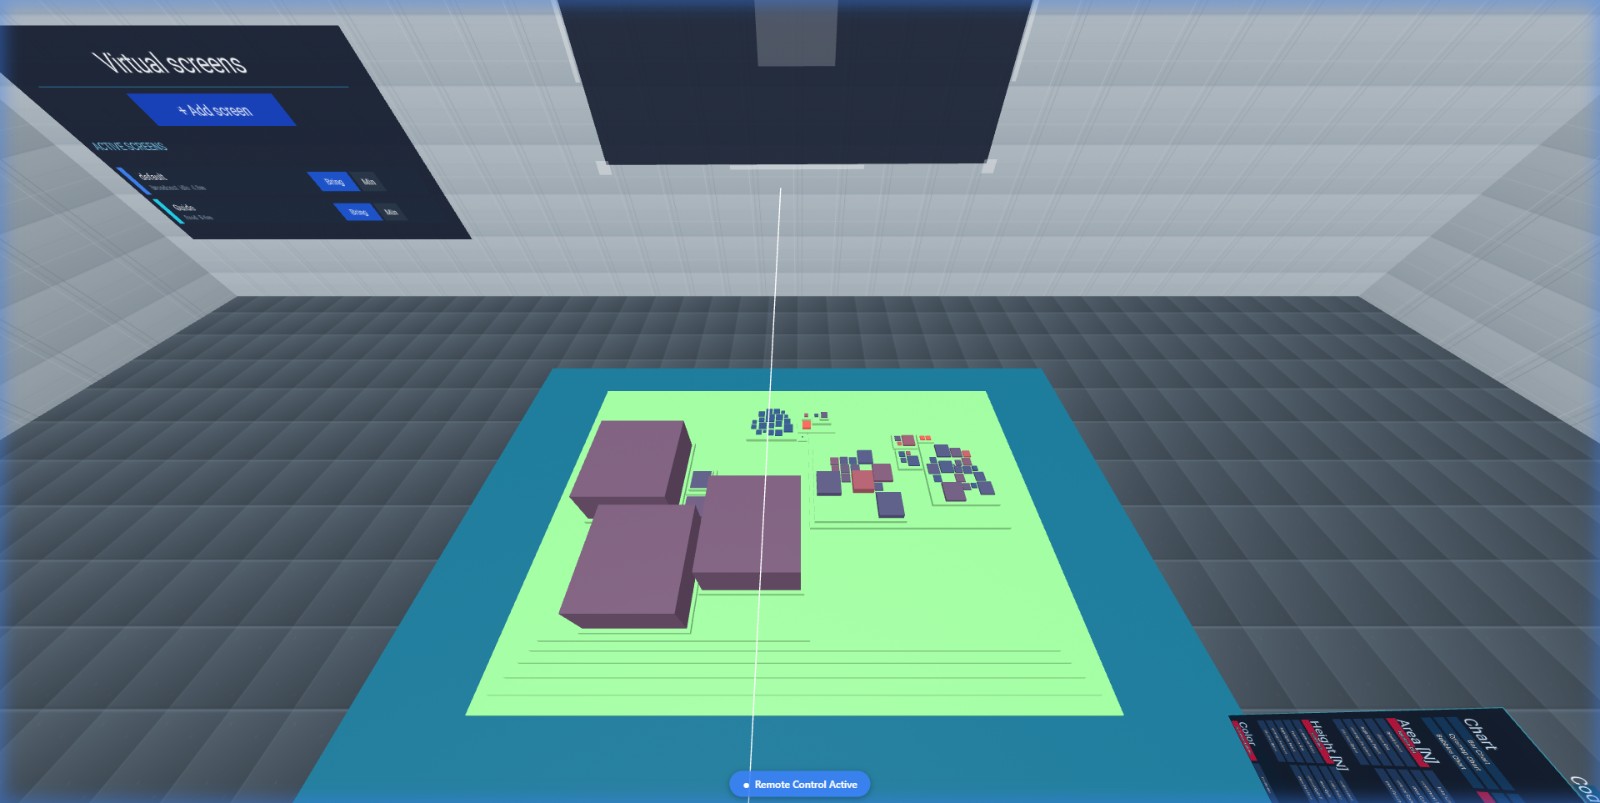
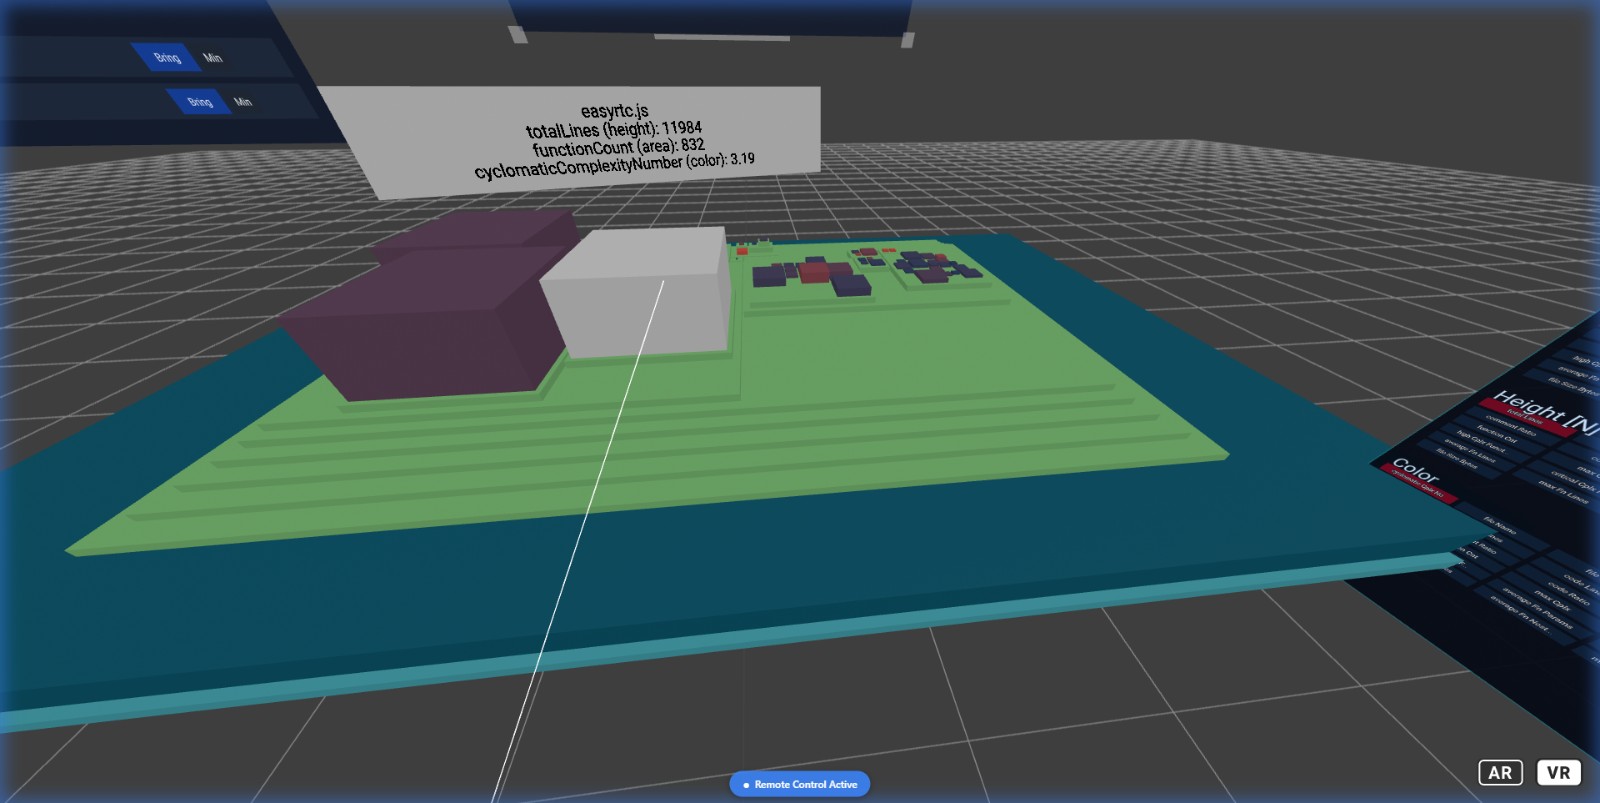
You don't have to take the immersive mode on faith. This release's VR and AR experience was driven and debugged end to end inside real WebXR sessions, emulated from a desktop browser with Meta's Immersive Web Emulator: entry height and positioning, stick locomotion and flight, laser aim and hand switching, what AR hides and keeps, AR lighting, and grabbing screens with the controller. The screenshots below come straight from those test sessions. Where you see extra panels and RGB gizmos around the controllers, that is the emulator's own tooling, not CodeXR.
Want to reproduce it (or validate on your own headset)? The WebXR emulator tutorial explains the setup and the manual VR/AR checklist is the validation script.
 |
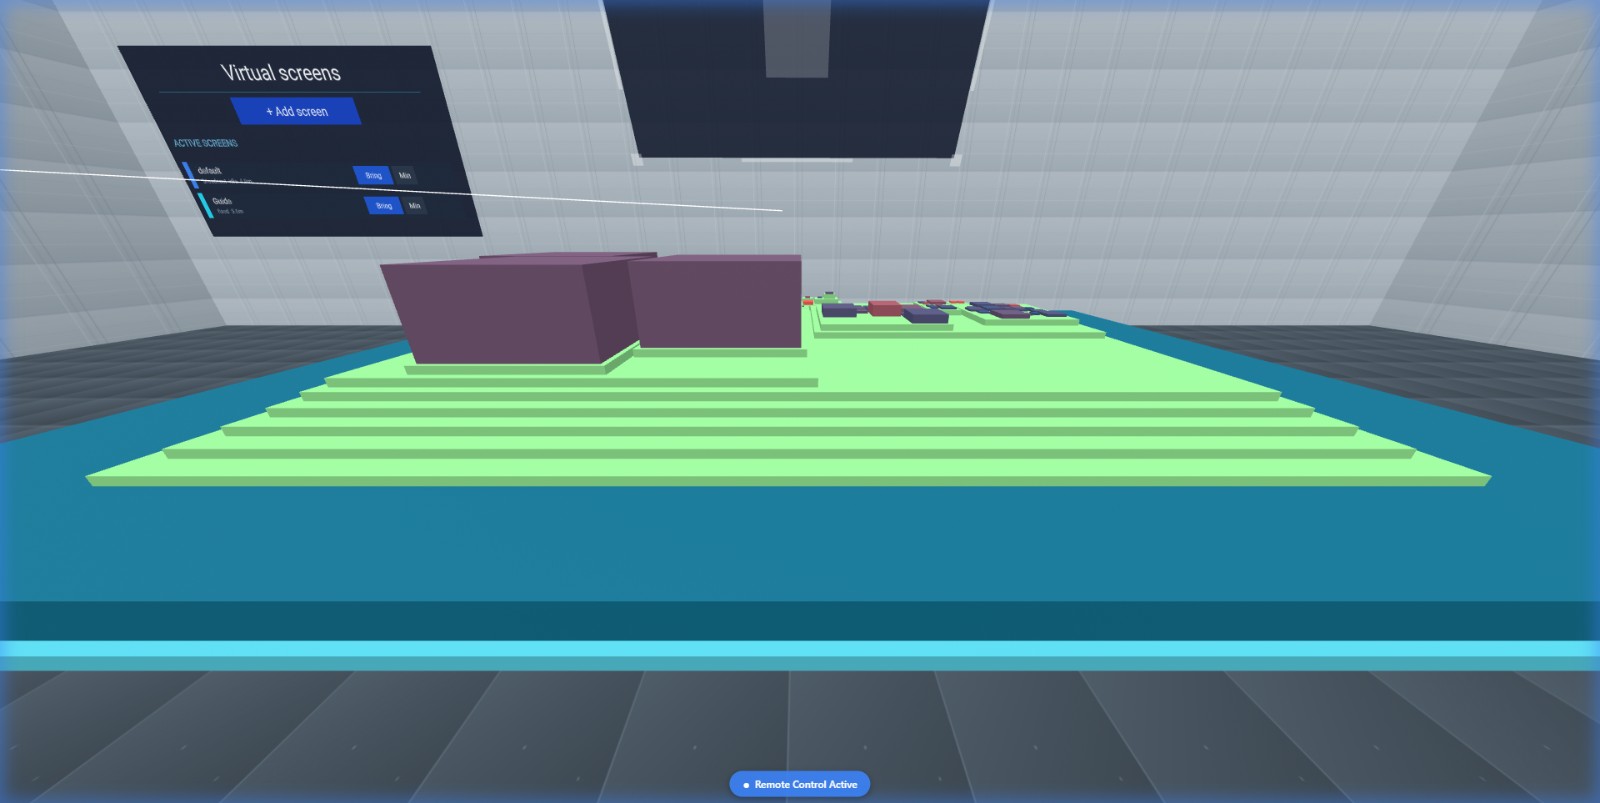 |
| The XR testing cockpit: a live VR session with the emulator's controller panels and gizmos around the scene | At the table: standing in VR at the pedestal's edge, the city one step away |
 |
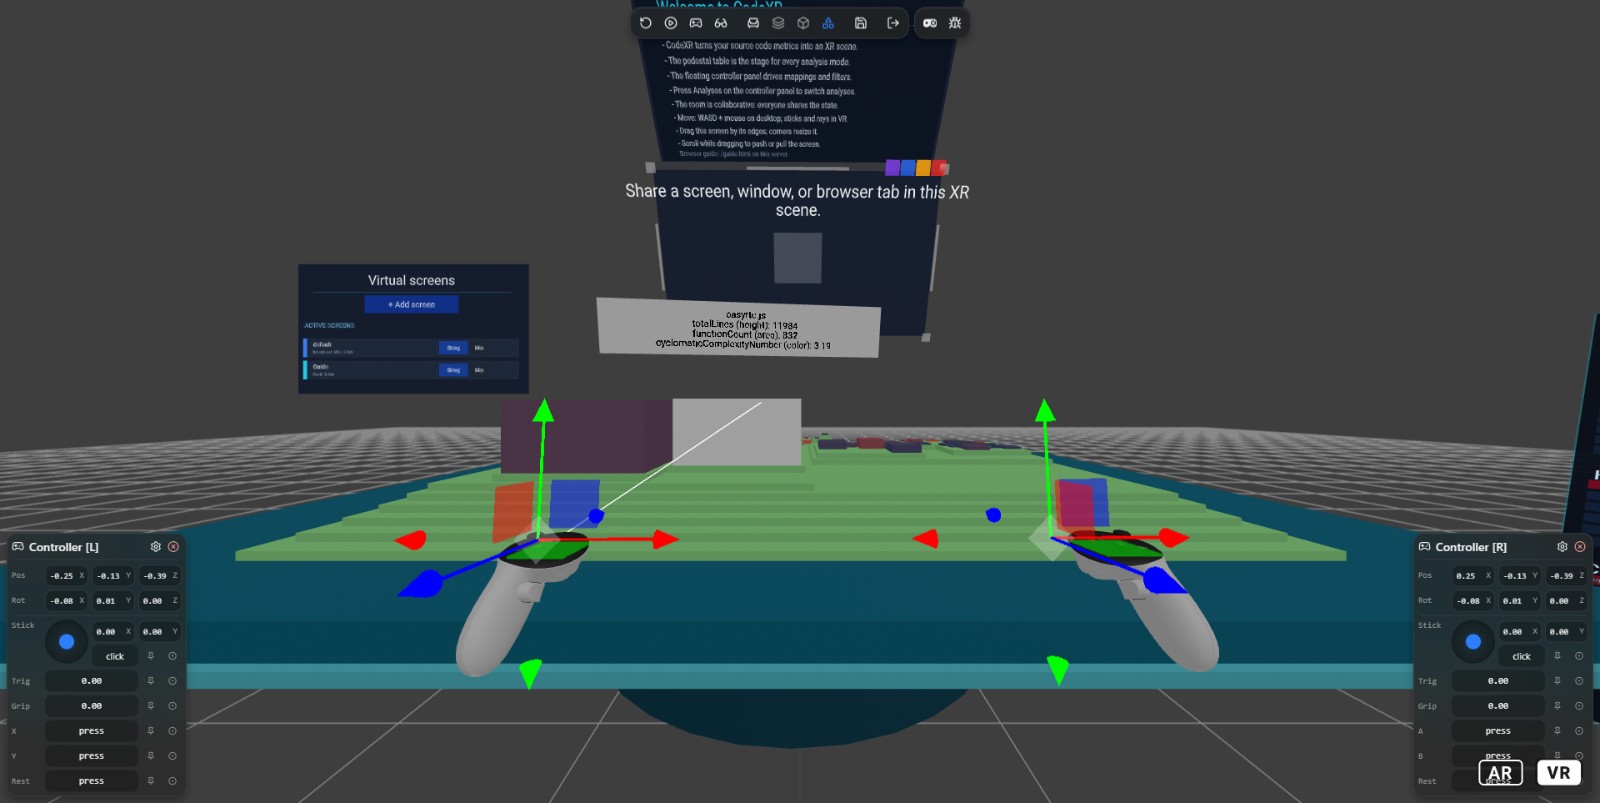 |
| Flying over the codebase: look up, push the stick, and read the skyline of your project | AR brings the table to you: recentered a step away, virtual room gone, charts fully lit |
 |
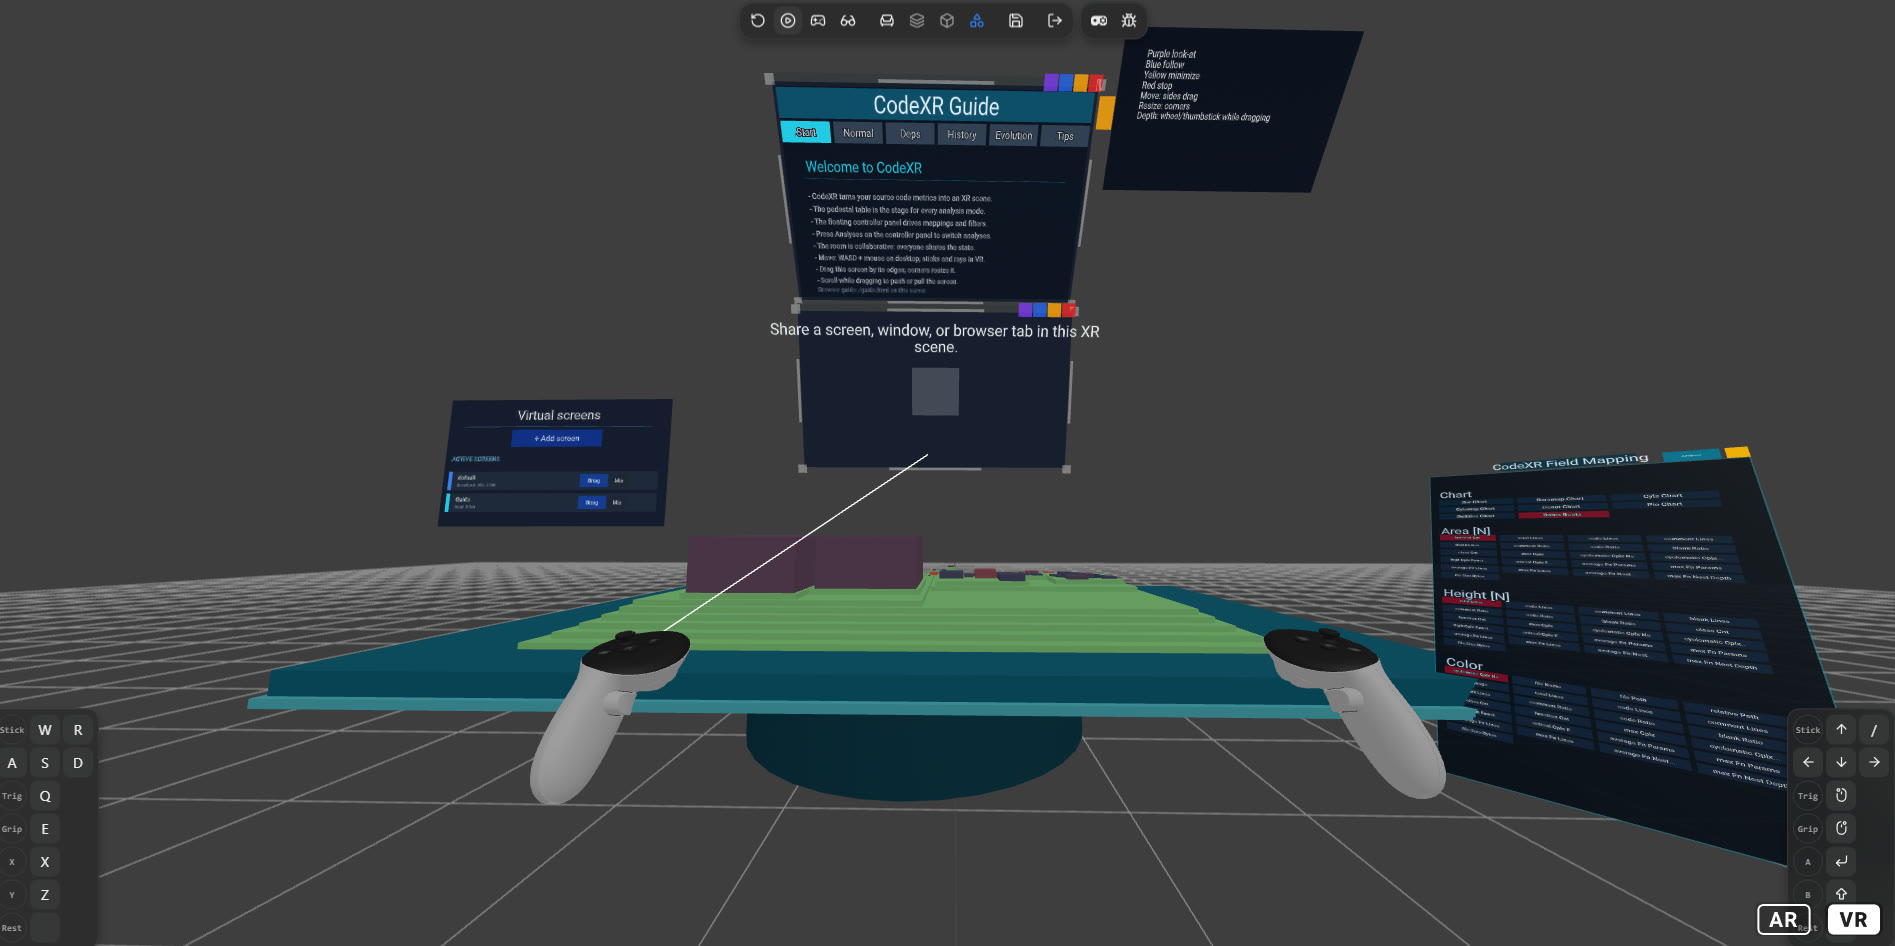 |
| Point and read, in your own room: a hovered building shows its file, lines, functions and complexity in passthrough | A full workspace in AR: pedestal, guide, screens and the Field Mapping panel, with the emulator's key maps overlaid |
Everything above builds on the workflows introduced up to v1.1.0: the UI, the analysis commands, LivePanel and the XR scene basics. These tutorials still describe that foundation accurately:
 |
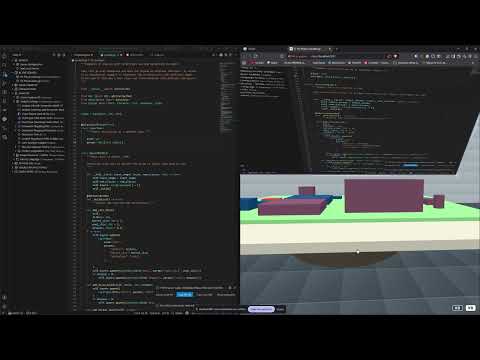 |
| Complete UI tutorial: the entire CodeXR interface and workflow | File XR analysis workflow: single-file analysis in XR |
 |
 |
| LivePanel mode: right-click & UI methods | XR mode: immersive 3D file analysis |
 |
 |
| Directory in LivePanel: detailed directory metrics | Directory in XR: 3D directory visualization |
 |
 |
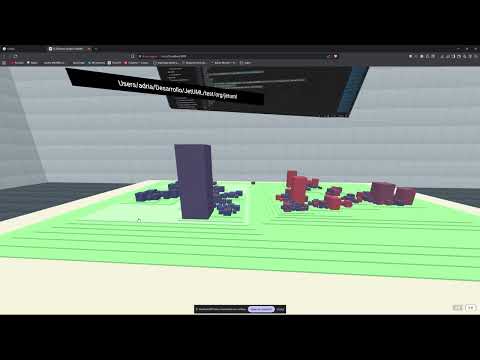
| Directory/project XR workflow: the updated XR flow | Project analysis: LivePanel and XR modes |
 |
 |
| DOM visualization: interactive HTML structure analysis | AR programming experience: real-world augmented reality coding |
- Right-click any file in VS Code Explorer
- Choose your analysis mode:
- "CodeXR: Analyze File (LivePanel)" - Detailed metrics panel
- "CodeXR: Analyze File (XR)" - Immersive 3D visualization
- "CodeXR: Visualize DOM" - HTML structure analysis (HTML files only)
- Open the CodeXR tree view in VS Code sidebar
- Expand "Project Structure" section
- Click on any file to analyze it (respects your configuration preferences)
- HTML files automatically open DOM visualization
- Other files use your preferred mode (LivePanel or XR)
- Press Ctrl+Shift+P (Windows/Linux) or Cmd+Shift+P (macOS)
- Type "CodeXR" to see all available commands
- Select your preferred analysis mode
- Right-click any folder in the Explorer
- Choose your analysis mode:
- "CodeXR: Analyze Directory (LivePanel)" - Standard directory analysis
- "CodeXR: Analyze Directory (XR)" - 3D directory visualization
- "CodeXR: Analyze Directory (LivePanel Deep)" - Recursive subdirectory analysis
- "CodeXR: Analyze Directory (XR Deep)" - Recursive 3D analysis with subdirectories
- Function List: Sortable table with complexity, lines of code, and parameter counts
- Complexity Distribution: Visual charts showing complexity patterns across your codebase
- Cyclomatic Density: Advanced complexity metrics per function
- Drill-down Details: Click any function for detailed analysis and code navigation
- Aggregated Metrics: Directory and project-level summaries
- Dependency Summary: Node, edge, external and cycle counters with top fan-in / fan-out rankings
- Historical Comparison: Pick two versions and get counts, a metric totals chart and a searchable delta table
- Export Capabilities: Save analysis results for documentation and reporting
- Four analyses on one table: The classic chart, the dependency graph, the historical dual table and the evolution movie; switch between them in-scene, each keeps its state
- 3D Charts: Bars, cylinders, bubbles, pie, donut, boats and more, showing your metrics in 3D space
- Runs in your browser: Mouse/keyboard navigation on any desktop; the same scene works with WebXR controllers when a headset is present
- Real-time Updates: Changes in your code immediately reflect in the visualization
- Customizable Mapping: Choose what metrics map to each dimension and colour, live, from inside the scene
- Spatial Understanding: Visualize code complexity relationships in 3D space
- Multi-file Visualization: See entire directories and projects at once
- Interactive Tree: Click to expand/collapse DOM elements
- Element Details: View attributes, content, and hierarchy information
- Visual Hierarchy: Clear parent-child relationships in tree structure
- Real-time Updates: See DOM changes as you edit HTML files
CodeXR offers powerful analysis modes, each optimized for different file types and use cases. All analysis modes support 24 code languages plus HTML DOM visualization with comprehensive file, directory, and project analysis capabilities.
Best for: Detailed metrics review, reporting, and comprehensive code analysis without leaving VS Code
Features:
- Comprehensive function-level analysis with accurate metrics
- Enhanced complexity distribution charts with improved layout
- Cyclomatic density calculations and complexity metrics
- Interactive drill-down panels for detailed function analysis
- Dependency Summary and 2D Historical Comparison sections
- Real-time updates as you edit code, directories, and projects
- Export capabilities for reporting and documentation
- Support for both standard and deep analysis modes
Best for: Spatial exploration of a codebase, in your desktop browser and optionally in VR/AR
Features:
- Four analyses served by one table: classic metrics city, dependency graph, historical comparison and Project Evolution
- Immersive 3D visualizations with bars, cylinders, bubbles, boats, and more
- Real-time updates as you edit code, directories, and projects without leaving the scene
- Full mouse + keyboard support in any desktop browser; A-Frame/WebXR controller bindings when a headset is connected
- Multi-dimensional metric mapping (complexity, LOC, parameters, file size), changeable live from the in-scene Field Mapping panel
- Customizable environments and color palettes for optimal viewing
- Support for both standard and deep analysis modes
Best for: HTML structure analysis and web development
Features:
- Interactive DOM tree exploration with click-to-expand functionality
- Element hierarchy visualization with clear parent-child relationships
- Real-time DOM structure analysis and attribute inspection
- Automatic routing from any analysis command when dealing with HTML files
- Element details including attributes, content, and positioning
Universal capabilities available for files, directories, and projects:
- 24 Code Languages + HTML DOM: Full support for JavaScript, TypeScript, Python, C/C++, C#, Java, Ruby, Go, PHP, Swift, Kotlin, Scala, Lua, Erlang, Zig, Perl, Solidity, TTCN-3, Objective-C, Fortran, GDScript, Vue, plus HTML DOM visualization
- Cyclomatic Complexity: Industry-standard complexity calculation using Lizard integration
- Lines of Code Metrics: Total lines, code lines, comment lines, and blank lines with language-aware parsing
- Function Analysis: Function count, parameter analysis, complexity per function, and cyclomatic density
- Class Detection: Object-oriented structure analysis including inheritance, interfaces, and nested classes
- Comment Analysis: Language-specific comment detection (single-line, multi-line, documentation)
- Real-time Updates: Automatic re-analysis when content changes (applies to all analysis modes: LivePanel, XR, DOM)
- Multiple Visualization Modes: Choose between LivePanel (detailed panels), XR (immersive 3D), or DOM (HTML structure)
Individual file deep-dive analysis:
- Single File Focus: Concentrated analysis of one file with detailed function-by-function breakdown
- Function-level Metrics: Individual function complexity, parameters, and lines of code
- Code Navigation: Direct navigation to specific functions and classes from analysis results
- Instant Analysis: Immediate results for quick code quality assessment
- Export Individual Reports: Save detailed reports for specific files
Complete directory analysis implementation
- Batch Processing: Analyze entire directories with progress tracking and status updates
- Recursive Scanning: Deep analysis modes for comprehensive subdirectory traversal (configurable depth)
- Hierarchical Metrics: Aggregated complexity and LOC metrics across directory structures
- Smart File Detection: Automatic identification and filtering of analyzable files by extension
- Directory-level Reporting: Combined metrics showing directory complexity distribution
- Subdirectory Comparison: Compare complexity across different subdirectories
- Large Directory Optimization: Efficient processing of directories with hundreds of files
- Selective Analysis: Option to exclude certain subdirectories or file patterns
Workspace-wide comprehensive analysis:
- Workspace-wide Scanning: Analyze entire VS Code workspaces including all folders and subprojects
- Cross-language Metrics: Combined complexity metrics across different programming languages
- Project Architecture Insights: Understand overall project complexity distribution and hotspots
- Language Distribution Analysis: See what percentage of your project is in each programming language
- Project-level Aggregation: Total lines of code, functions, classes, and complexity across entire project
- Comprehensive Reporting: Detailed analysis reports covering entire project structure and complexity
- Large Project Optimization: Optimized for analyzing projects with thousands of files
CodeXR provides comprehensive analysis for 24 code languages, plus HTML DOM visualization, through its unified analysis engine:
| Language | Extensions | Analysis Types | Comment Detection | Class Detection |
|---|---|---|---|---|
| JavaScript | .js, .mjs, .cjs | LivePanel, XR | C-style (//, /* */) | ES6 Classes |
| TypeScript | .ts, .tsx | LivePanel, XR | C-style (//, /* */) | Classes & Interfaces |
| Python | .py, .pyw, .pyi | LivePanel, XR | Hash (#) + Docstrings | Classes & Methods |
| C/C++ | .c, .cpp, .cc, .cxx, .h, .hpp, .hxx | LivePanel, XR | C-style (//, /* */) | Classes & Structs |
| C# | .cs | LivePanel, XR | C-style (//, /* */) | Classes & Namespaces |
| Java | .java | LivePanel, XR | C-style (//, /* */) | Classes & Interfaces |
| Ruby | .rb, .rbw | LivePanel, XR | Hash (#) + Block (=begin/=end) | Classes & Modules |
| Go | .go | LivePanel, XR | C-style (//, /* */) | Structs & Interfaces |
| PHP | .php, .phtml, .php3, .php4, .php5 | LivePanel, XR | C-style + Hash (//, #, /* */) | Classes & Traits |
| Swift | .swift | LivePanel, XR | C-style (//, /* */) | Classes & Structs |
| Kotlin | .kt, .kts | LivePanel, XR | C-style (//, /* */) | Classes & Objects |
| Scala | .scala, .sc | LivePanel, XR | C-style (//, /* */) | Classes & Objects |
| Lua | .lua | LivePanel, XR | Double dash (--) | Table-based OOP |
| Erlang | .erl, .hrl | LivePanel, XR | Percent (%) | Modules |
| Zig | .zig | LivePanel, XR | C-style (//) | Structs |
| Perl | .pl, .pm | LivePanel, XR | Hash (#) | Packages |
| Solidity | .sol | LivePanel, XR | C-style (//, /* */) | Contracts |
| TTCN-3 | .ttcn, .ttcn3 | LivePanel, XR | C-style (//, /* */) | Modules |
| Objective-C | .m, .mm | LivePanel, XR | C-style (//, /* */) | Classes & Categories |
| Fortran | .f90, .f95, .f03, .f08, .f | LivePanel, XR | Exclamation (!) | Modules & Types |
| GDScript | .gd | LivePanel, XR | Hash (#) | Classes |
| Vue.js | .vue | LivePanel, XR | HTML () | Component Analysis |
| HTML | .html, .htm, .xhtml | DOM Visualization | HTML Comments | Element Structure |
All Languages Support:
- Lines of Code (LOC) counting with accurate parsing
- Cyclomatic Complexity analysis using industry-standard algorithms
- Function parameter counting and analysis
- Accurate comment detection with language-specific rules
- Real-time analysis with intelligent file watching
- Multi-file analysis support for batch processing
Advanced Features:
- Comment Analysis: Language-aware parsing for single-line, multi-line, and documentation comments
- Class Detection: Object-oriented structure analysis including inheritance and nested classes
- Function Metrics: Parameter counting, complexity scoring, and density calculations
- File Organization: Smart sorting and filtering by language in the tree view
- Mouse: Click and drag to rotate view around code visualizations
- WASD Keys: Navigate through the 3D space like a first-person game
- Scroll Wheel: Zoom in and out for detailed or overview perspectives
- Arrow Keys: Alternative navigation for fine-tuned movement
The standard VR scheme, driven by A-Frame's native controls:
- Left thumbstick: Move fluidly, toward where you are looking. In VR and AR you fly: look up and push forward to rise over the city, look down to descend
- Right thumbstick: Turn smoothly
- Trigger: Point and click, with either hand; the pointer follows whichever controller you last used
- Gaze: Before any controller connects, a reticle lets you point with your head
Controller support is implemented through standard A-Frame/WebXR bindings, but this release has not been validated on physical headset hardware. See Feedback below.
The "Active Analyses" section in the tree view provides comprehensive session management:
- View Status: See which files, directories, or projects are currently being analyzed
- Prevent Duplicates: Automatically prevents multiple analyses of the same target
- Left-Click Action Menu: Click any active analysis to open its action menu with details, browser access, export, and close options
- Easy Cleanup: Close analyses you no longer need to free system resources
- Session Details: View detailed information about each active analysis
- Browser Integration: Open analyses directly in your browser
- Export a self-contained copy: Exporting opens a selector where you choose what travels: the normal analysis (always included), the dependency graph (generated during export if you never opened it), and the two git analyses. Picking those pre-analyzes the whole git timeline (up to 240 revisions, shared between both modes, cancellable; it can take a while on big repositories) so the copy is fully interactive offline: serve it with any static HTTP server (
npx serve) and you can compare ANY two exported revisions and generate ANY movie (Auto, Range or Manual) without CodeXR behind it. AREADME-EXPORT.mdinside the copy explains the details
Access settings directly from the tree view or VS Code preferences:
- Default Analysis Mode: Choose between LivePanel and XR as your default
- Deep Analysis Settings: Configure default behavior for directory and project analysis
- Debounce Timing: Adjust how quickly analysis responds to code changes
- Auto-analysis: Enable/disable automatic re-analysis on file save
- File Filtering: Configure which file types to include/exclude from analysis
- Cross-network Connections: Enable or disable remote access on your servers (on by default; disabling stops every tunnel and removes the
cloudflaredcopy CodeXR downloaded). Declining the one-timecloudflareddownload turns this off too, so you are asked again only once you re-enable it.
Customize your scene:
- Chart Types: Bars, cylinders, bubbles, boats, and more visualization options
- Color Palettes: Business, Blues, Commerce, Flat, Foxy, and other professional themes
- Environment Themes: Forest, Dream, City, Space, and more immersive backgrounds
- Dimension Mapping: Customize what metrics map to 3D dimensions and colors
- Performance Settings: Adjust rendering quality for your hardware
- VS Code: Version 1.98.0 or higher
- Python: Automatically configured on Windows, Linux, and macOS (isolated virtual environment created if needed)
- A modern browser: Chrome, Edge or Firefox for the 3D scenes; a WebXR-capable browser only if you want the immersive mode
- VR/AR hardware: Entirely optional
- Open Visual Studio Code
- Go to Extensions (Ctrl+Shift+X)
- Search for "CodeXR"
- Click "Install"
- Restart VS Code for full functionality
- CodeXR automatically sets up the Python environment on first use
- No additional configuration required for basic functionality
- HTTPS certificates are generated locally on first startup and stored in the extension's VS Code global storage for WebXR compatibility
- Virtual environment (.venv) is created automatically for isolated dependencies
- Before Code Reviews: Quickly identify complex functions that need attention
- Refactoring Planning: Visualize complexity hotspots across your entire codebase
- Impact Analysis: Use the dependency graph to see what a change will touch before you make it
- Technical Debt: Track complexity trends over time with Historical Comparison and Project Evolution
- Code Standards: Ensure code meets complexity and quality standards
- Architecture Discussions: Share 3D visualizations in team meetings, locally or across networks
- Onboarding: Help new team members understand codebase structure, with the in-room guide answering "what am I looking at"
- Code Reviews: Enhanced visual context for reviewing complex code
- Shared Working Sessions: Create or move shared virtual screens, remap charts, and watch other participants interact with the same live room in real time
- Learning Patterns: Visualize how different programming patterns affect complexity
- Algorithm Comparison: Compare multiple implementations in 3D space
- Code Metrics Education: Understand complexity metrics through interactive visualization
- Programming Courses: Teach software engineering concepts with visual aids
- Large Files: Increase debounce delay for files over 1000 lines
- Resource Management: Close unused analyses to free system resources
- Directory Analysis: Use standard mode first, then deep mode for comprehensive analysis
- Multiple Projects: Use LivePanel mode for quick analysis, XR for deep exploration
- AR Mode: Use on mobile devices or AR headsets for best experience
- VR Navigation: Take breaks during long analysis sessions to prevent fatigue
- Controller Setup: Ensure controllers are charged before starting VR sessions, and please report any controller issue you hit, since this release could not be validated on physical hardware
- Lighting: Ensure adequate room lighting for AR tracking
- Validate without a headset: the whole immersive experience can be exercised from a desktop browser with Meta's Immersive Web Emulator. See the emulator tutorial and the manual VR/AR checklist
- Start with LivePanel: Get overview with LivePanel analysis
- Explore in 3D: Open the XR mode in your browser for spatial exploration of complex code
- Use Active Analyses: Monitor all open visualizations from tree view
- Configure Settings: Adjust debounce timing based on your coding style
- Directory Analysis: Start with standard mode, use deep mode for comprehensive coverage
- Python-based Coordinators: Redesigned Python-based analysis coordinators for better accuracy
- Multi-language Parsing: Advanced parsing capabilities for 24 code languages plus HTML DOM visualization
- Lizard Integration: Industry-standard complexity analysis using Lizard tool
- Dependency Extraction: Static relation analysis (imports, includes, inheritance, calls) with per-relation confidence
- Git Snapshots: Historical analyses materialize temporary snapshots without ever touching your working tree or
.git - Performance Optimization: Optimized for handling large codebases efficiently
- BabiaXR Integration: Powerful 3D rendering using BabiaXR framework
- A-Frame 1.7.1: Latest WebXR framework for immersive experiences
- CodeXR Components: The dependency graph, containment engine, guide screen and evolution player are CodeXR's own A-Frame components
- Interactive Panels: Responsive web panels for LivePanel analysis
- Real-time Data Binding: Live updates between code changes and visualizations
- Unified Registry: Centralized session tracking and management
- Lifecycle Management: Proper initialization, monitoring, and cleanup
- Progress Tracking: Real-time progress reporting for long-running operations
- Error Handling: Comprehensive error recovery and user feedback
- Visual Studio Code: 1.98.0 or higher
- Node.js: 16+ for extension runtime
- Python: 3.7+ (automatically managed through virtual environment)
- Memory: 4GB RAM minimum, 8GB recommended for large projects
- Storage: 100MB for extension, additional space for analysis results
CodeXR automatically manages the following dependencies:
- Python Virtual Environment: Created in
globalStoragedirectory from VS Code - Lizard: Code complexity analysis tool
- tree-sitter-language-pack: Structured parsers for the XR dependency graph
- Required Python Packages: Automatically installed as needed
- Cloudflare remote access
- Historical comparison XR
- Dependency graph XR
- XR browser diagnostics
- Testing VR/AR without a headset: WebXR emulator tutorial
- Manual VR/AR validation checklist
- WebXR Browser: For the immersive VR/AR experience
- VR Headset: Oculus, Valve Index, HTC Vive, etc. (optional)
- AR Device: ARCore/ARKit compatible device (optional)
- cloudflared: Only for cross-network sessions; version-pinned, downloaded with your consent and SHA-256 verified
# Clone the repository
git clone https://github.com/aMonteSl/CodeXR.git
cd CodeXR

# Install dependencies
npm install

# Compile the extension
npm run compile

# Build for production
npm run package# One-time build
npm run compile
# Watch mode for development
npm run watch
# Create VSIX package
npm run package:vsix
# Run tests
npm run test- Node.js: 16+
- Python: 3.7+ (for analysis components)
- TypeScript: For extension development
- Webpack: For bundling (configured automatically)
We welcome contributions! Here's how you can help:
- Fork the repository on GitHub
- Create a feature branch for your changes
- Make your changes with appropriate tests
- Submit a pull request with detailed description
- Follow our coding standards and include documentation
- Language Support: Add support for additional programming languages
- Visualization: New chart types and visualization modes
- Performance: Optimization for large codebases
- Documentation: Improve guides and examples
- Testing: Expand test coverage
This release was validated on desktop browsers, through CodeXR's automated test suites (unit tests, Python analysis suites and browser harnesses), and end to end on emulated WebXR sessions using Meta's Immersive Web Emulator. That emulator is what let us find and fix real immersive bugs before shipping: entry height and positioning, what AR hides and keeps (environment, room walls, invisible colliders), stick locomotion and flight, laser aim and hand switching, AR lighting, and grabbing screens with the controller. It still could not be tested on a physical VR headset: everything is built on standard WebXR/A-Frame bindings and should work, so if you run CodeXR on real hardware and anything misbehaves (the manual VR/AR checklist is a good script to follow), please open an issue: a device name and a couple of lines about what went wrong are enough, and every report directly improves the next release.
- GitHub Issues: Report bugs and request features at GitHub Issues
- Documentation: Comprehensive guides and examples at the official website
- Community: Share your visualizations and use cases
- ⭐ Star the project on GitHub
- Leave a review on the VS Code Marketplace
- Share your ideas: feature proposals and improvement suggestions are genuinely welcome in Issues; several v1.2.0 features started as user feedback
This project is licensed under the GNU General Public License v3.0 (GPLv3) - see the LICENSE file for details.
- You can use, study, and modify the software.
- If you distribute modified versions, you must also provide the source code under GPLv3.
- Derivative works distributed to others must remain under GPLv3-compatible terms.
- The software is provided without warranty.
- BabiaXR Team: For the powerful visualization framework
- A-Frame Community: For WebXR support and immersive web technologies
- Lizard Tool: For reliable code complexity analysis
- Meta's Immersive Web Emulator & IWER: For making real WebXR sessions drivable from a desktop browser, the tooling behind this release's XR validation
- VS Code Extension API: For the extensible platform
- Open Source Community: For continuous feedback and contributions
CodeXR v1.2.0: understand your code by standing in it. Metrics, architecture and history as places you can visit: from your editor, in your browser and, when you want it, in a headset.
CodeXR is created and maintained by Adrián Montes Linares.
- Website: https://adrianmonteslinares.com/
- CodeXR site: https://code-xr.adrianmonteslinares.com/
If you find CodeXR valuable and would like to support its continued development, consider buying the developer a coffee:

Your support helps me:
- Add new features and improvements
- Fix bugs and maintain compatibility
- Provide better support and documentation