
( Ian Macharia , Pauline Ndung'u , Dennis Mwanzia , Samuel Igecha , Pamela Awino )
The aim of this project is to put into practice our newly aqcuired skills in data science to formulate and solve a real business problem. In this project, we are given a raw dataset which is the house sales prices in Northwestern County and we are supposed to formulate a real business case study and use the data to solve the business problem and provide a useful business advisory which can be used to formulate real and valuable business decisions. Unlike in phase 1, we are not given the business problem, its upon us to formulate it.
- Data We utilized the following dataset to help make predictions of house prices in Kings County King County House Data: a dataset that we were provided at the onset of the project. This file contains data for 21,597 homes built in King County, Seattle from 1900 to 2015. Each home in the set contains information regarding features such as number of bedrooms/bathrooms, number of floors, square footage, zip code, condition, and more.
- id
- date
- price
- bedrooms
- bathrooms
- sqft_living
- sqft_lot
- floors
- waterfront
- view
- condition
- grade
- sqft_above
- sqft_basement
- yr_built
- yr_renovated
- zipcode
- lat
- long
- sqft_living15
- sqft_lot15
The business problem is to provide guidance to Kings Wajenzi Developers, a prospective real estate developer in King County, on the most profitable types of properties to target in the current market. The guidance will include recommendations on optimal locations to develop properties, features most desired by customers and have the greatest impact on prices of properties, and season of year when homeowners are most likely to purchase properties. Our objective as Wataalamu Analytics Advisors is to analyze house sales data in King County which was collected between May 2014 and May 2015 and leverage the insights generated to guide the developer in selecting the most profitable properties to develop and maximize their profits. With King County's population on the rise and income stabilizing after the COVID-19 pandemic, demand for new homes in the area is at an all-time high.
-
To determine whether the time of year affects the price of a house and identify the most profitable seasons/months.
-
To investigate whether location affects house prices in King County and identify the areas that attract the highest prices.
-
To determine which features/attributes have the highest impact on the sales price of houses/properties in King County and identify the features that developers should focus on when developing upcoming projects in the area.
- Does the time of the year affect the price of an house? If yes, which seasons/Months are most profitable?
- Does Location affect prices? If yes, which locations within King county attract highest price of houses?
- Which features/Attributes have the highest impact on sales price of houses/properties? Which features should the developer focus on when developing their upcoming projects in King County
This project follows the OCEMiN Data Science framework for data analysis
- Obtain/import data
- We will import dataimport data from King County House Data provided as csv, using Pandas library.
- Clean/ Scrub data
- We will employ several data cleaning methods to modify and prepare the dataset for analysis.
- Explore data/EDA
- Analyzing and visualizing the cleaned data to gain insights, identify patterns and relationships, and formulate hypotheses.
- Model/Develop the predictive Model
- Develop and evaluate predictive models using the data.
- Interpret Data
- Draw conclusions and make decisions based on the results of the analysis.
How do different Priced houses relate with the number of bedrooms?
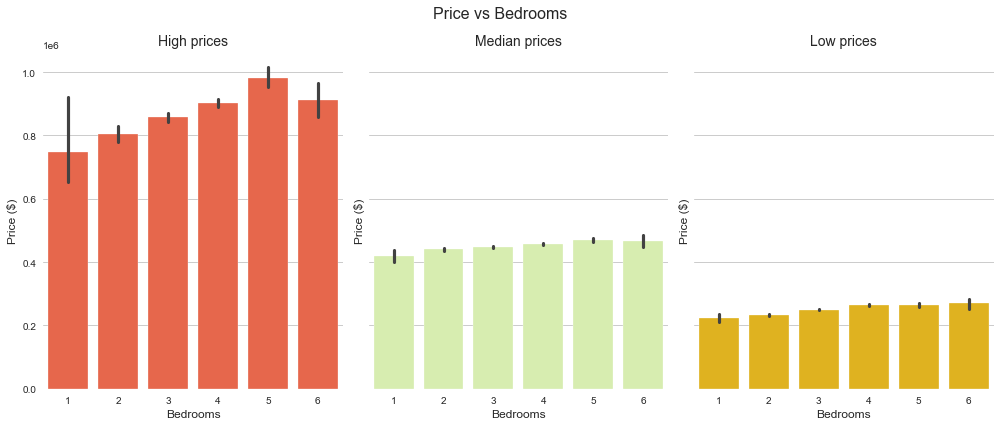
Here, we can see that the larger the number of bedrooms, the higher the prices as well. For average and low-priced houses, there isn't much of an increase but more of constant with a slight increase in prices with the number of bedrooms.
How do different Priced houses relate with the number of bathrooms?
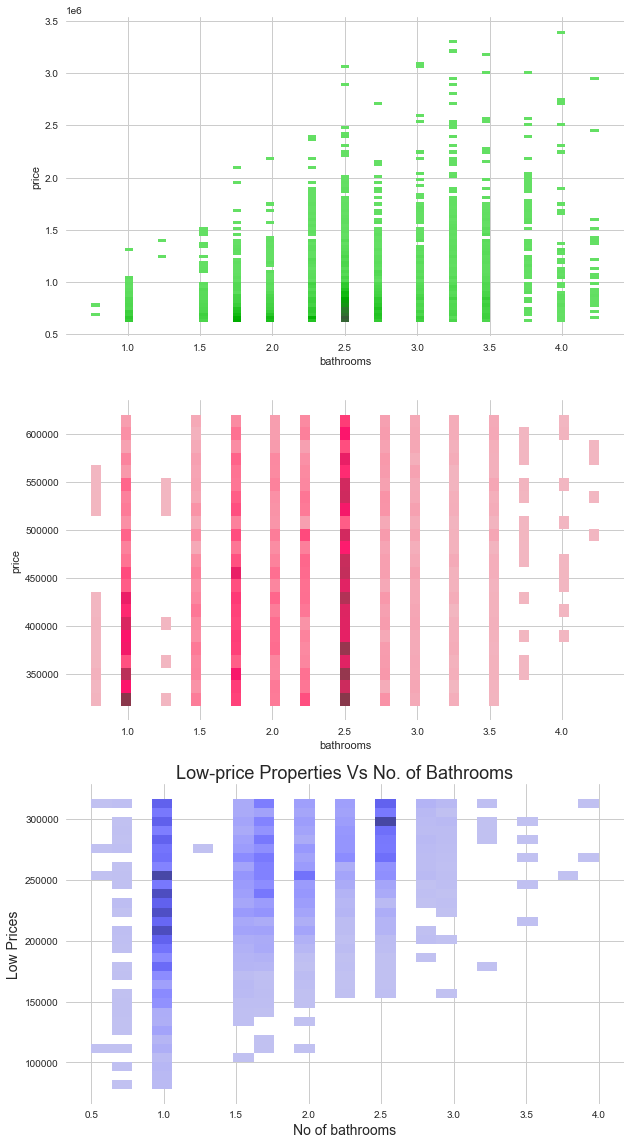
From the Histogram we observed that the majority of median and high-end properties had a higher density at two bathrooms with and aditional bathtub, toilet or sink. From the high end we also noticed that the density was more towards the median showing that there is little difference that distinguished them from the median. For the low price range the density was more on one bedroomed houses indicating a prevalence of studio apartments.
The histograms suggest that the number of bathrooms is positively correlated with the price of properties. However, we need to perform statistical analysis to confirm this relationship and identify the strength of the relationship.
How do different-priced houses relate with the seasons?
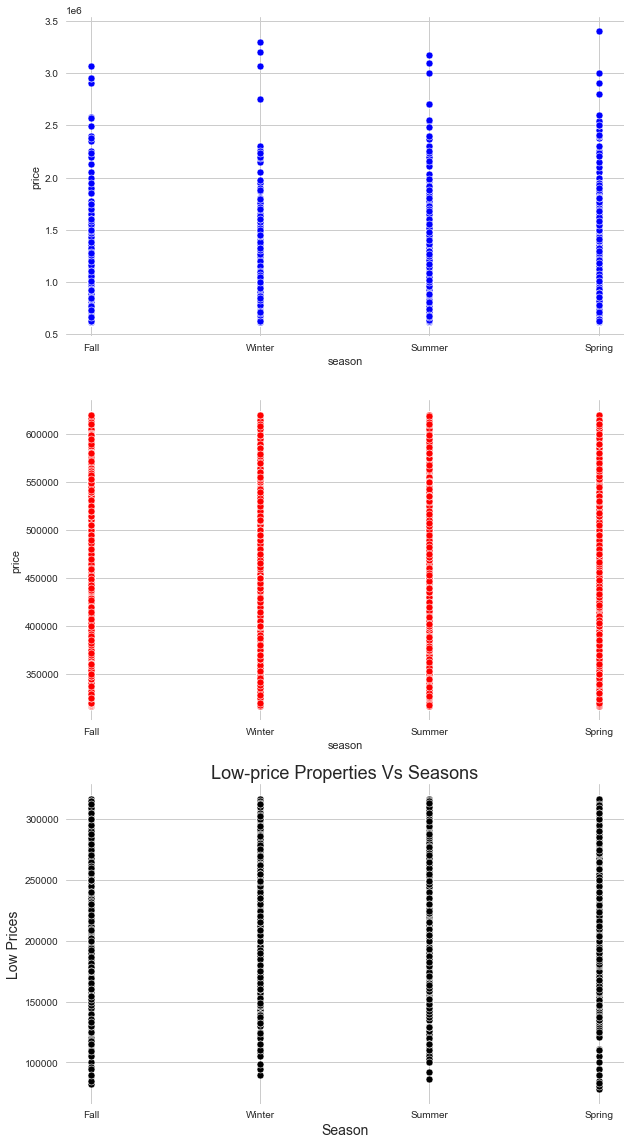
Based on the provided data, the scatter plots show the relationship between the season and the prices of properties in the dataset. From the count of properties sold in each season, it appears that spring and summer are the most popular seasons for home buying, while fall and winter have comparatively fewer sales.
The scatter plots of high-end, medium, and low-price properties against the season show that the prices of properties are generally consistent across all seasons. However, there is a slight increase in the number of high-end properties sold in the spring and a decrease in the number of low-priced properties sold in the winter.
This pattern may be due to various factors, including the perceived desirability of certain seasons for buying and selling homes, the availability of listings during different seasons, or even the preferences of buyers and sellers. For example, the spring season may be associated with better weather conditions and more opportunities for home viewing, which may increase demand for high-end properties. Conversely, the winter season may be associated with lower sales of low-priced properties due to holiday expenses and colder weather. However, further analysis would be necessary to determine the exact reasons for these trends.
*Seasons
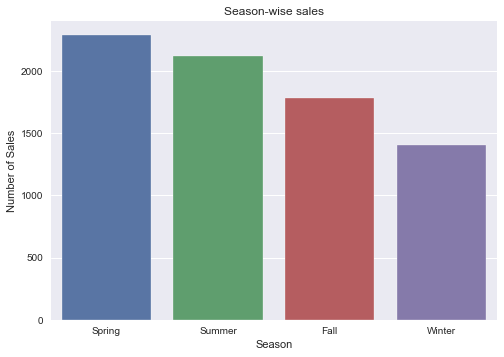
Looking at the sales data, we can see that the spring months of March, April, and May are the best for selling houses with a total of 6518 sales. This is likely due to the fact that Spring is a time of renewal and growth, and people may be more willing to make big changes such as buying a new home during this time. May is the most popular month for selling homes within Spring, with 2414 sales.
Summer, which comprises the months of June, July, and August, had a slightly lower total sales of 6328 compared to spring. July had the highest sales with 2211 followed by June with 2178 and August with 1939.
The fall season of September, October, and November had a total of 5056 sales, with October having the highest sales of 1876 followed by September with 1771 and November with 1409.
Lastly, the winter season of December, January, and February had the lowest total sales of 3695. December had the highest sales with 1470 followed by February with 1247 and January with 978. This may be due to the fact that Winter is a time when people tend to stay indoors and may be less inclined to go through the hassle of buying or selling a home.
Overall, it is important to note that this conclusion is based solely on the provided data and may not be reflective of larger trends in the housing market. Additionally, there may be some inaccuracies in the data such as missing or incomplete records, which could affect the accuracy of these findings.
How does Location affect the Sale Price of a house?
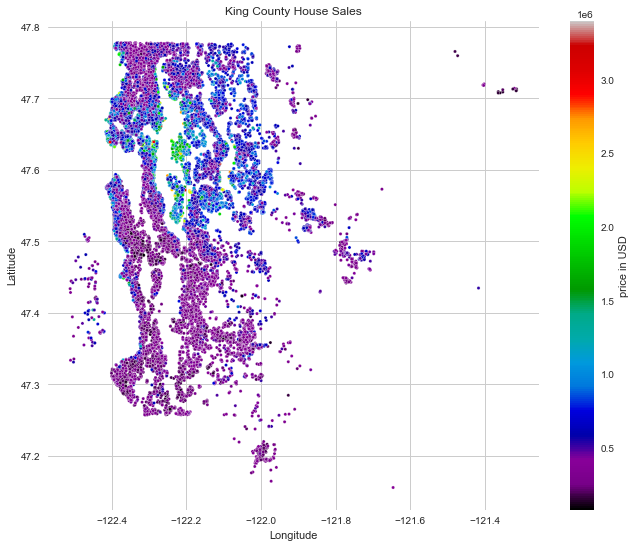
From this visualisation we can already draw initial insights based on the houses' geographical locations. The highest house prices are concentrated in the area with latitude around 47.6 and longitude around -122.25. There is a disparity with southern locations achieving lower house prices.
However there is no context to help us! We would need an underlying map to understand where the cities, highways, bodies of water etc. are located. It is difficult to draw meaningful conclusions with this visualisation alone.
Whilst we could define quadrants using the latitude and longitude, let us seek to plot the houses on a map instead.
Map of house sales To visualise house sales on a map, we will use Bokeh and the built-in map tile from Carto DB. Note that Bokeh requires Mercator coordinates so we will need to convert our latitude and longitude values.
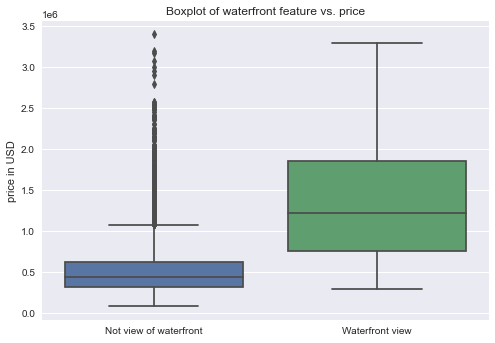
Does the Presence of a waterfront feature affect its price?
From the maps, it is apparent that being on the waterfront is highly sought after and many of the most expensive houses in our dataset have this feature. We have been provided with a waterfront feature, which characterises houses which have a view of a waterfront. Let us investigate how this feature relates to price by using a boxplot.
The objective of modeling is to build a model that has the ability to make accurate predictions of the target variable for new data, indicating that it can generalize well. The modeling procedure encompasses the selection of suitable algorithms, feature engineering, fine-tuning of hyperparameters, and evaluation of the model's performance.
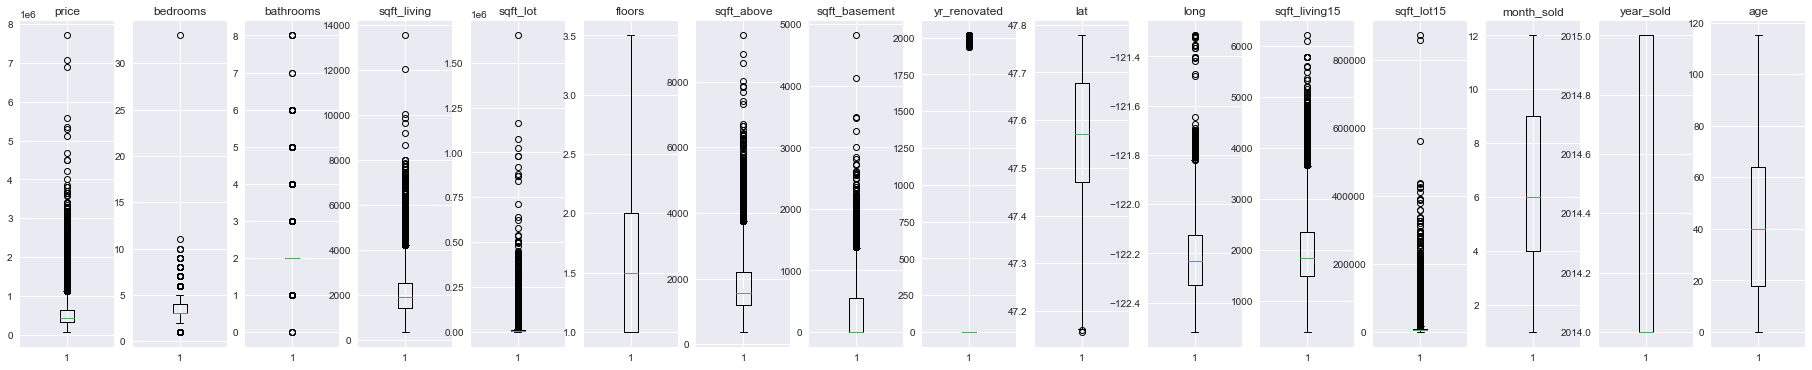
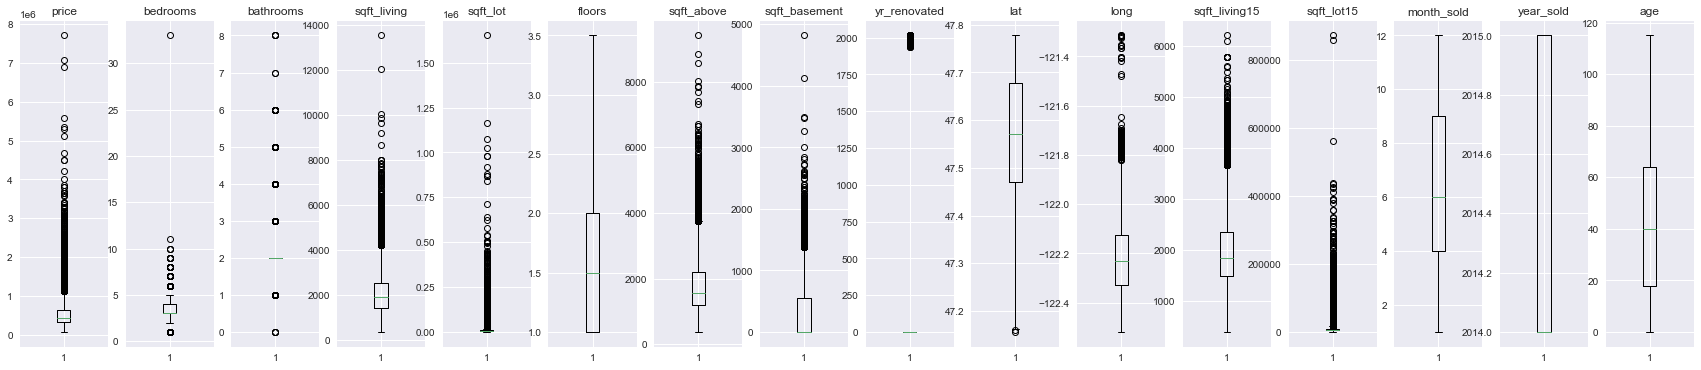
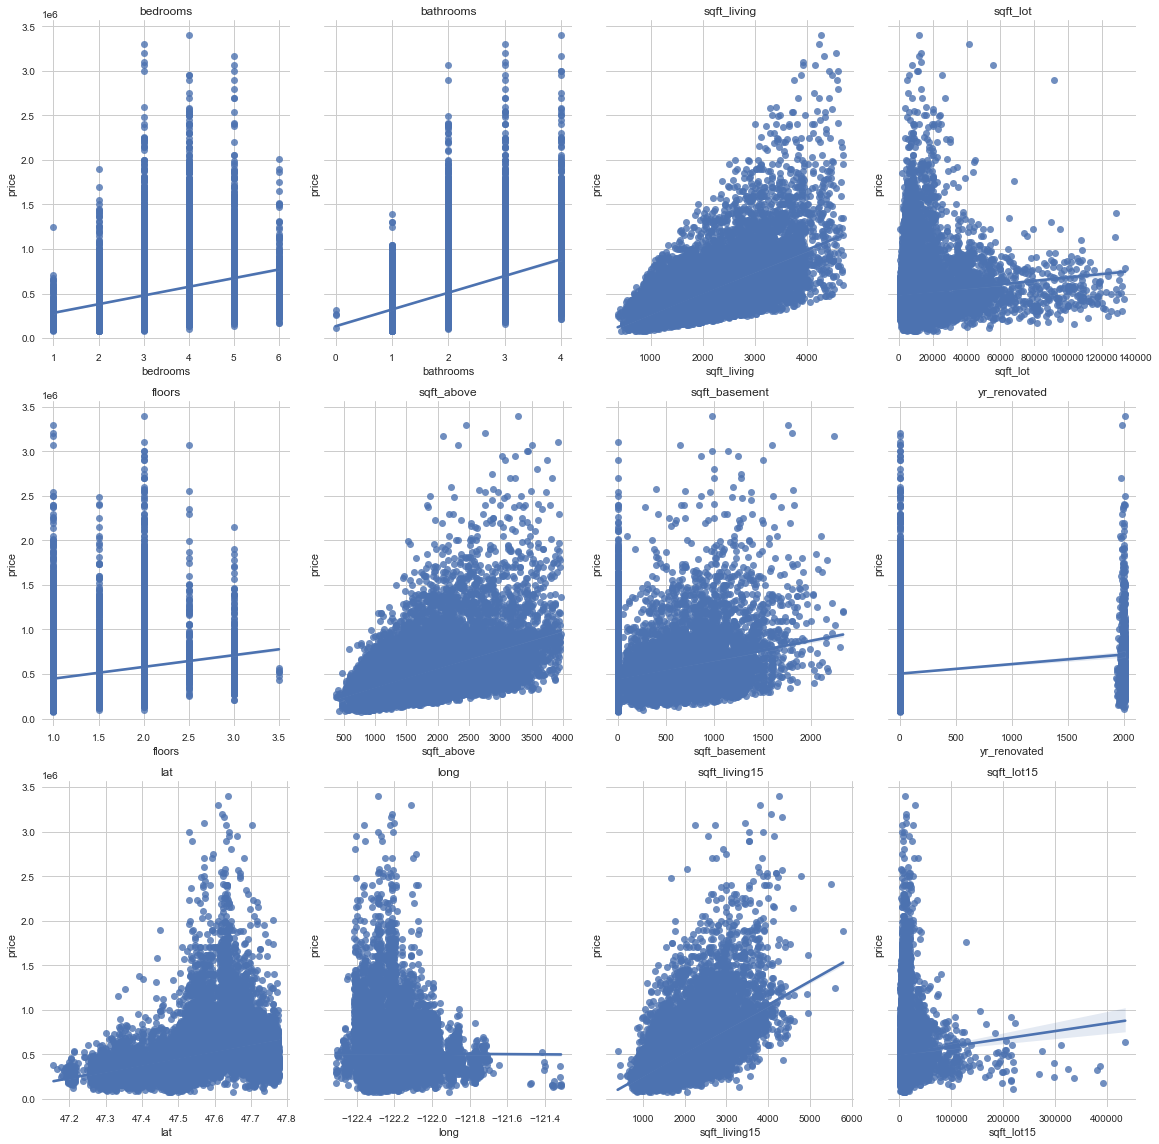
*Test for Linearity
Based on the data analysis, it appears that most of the variables have a linear relationship to the price, and their relationship appears to be homoscedastic. However, there are some variables, including sqft_lot, floors, condition, latitude, longitude and sqft_lot15, that do not seem to have a linear relationship with price.
*Multi-collinearity
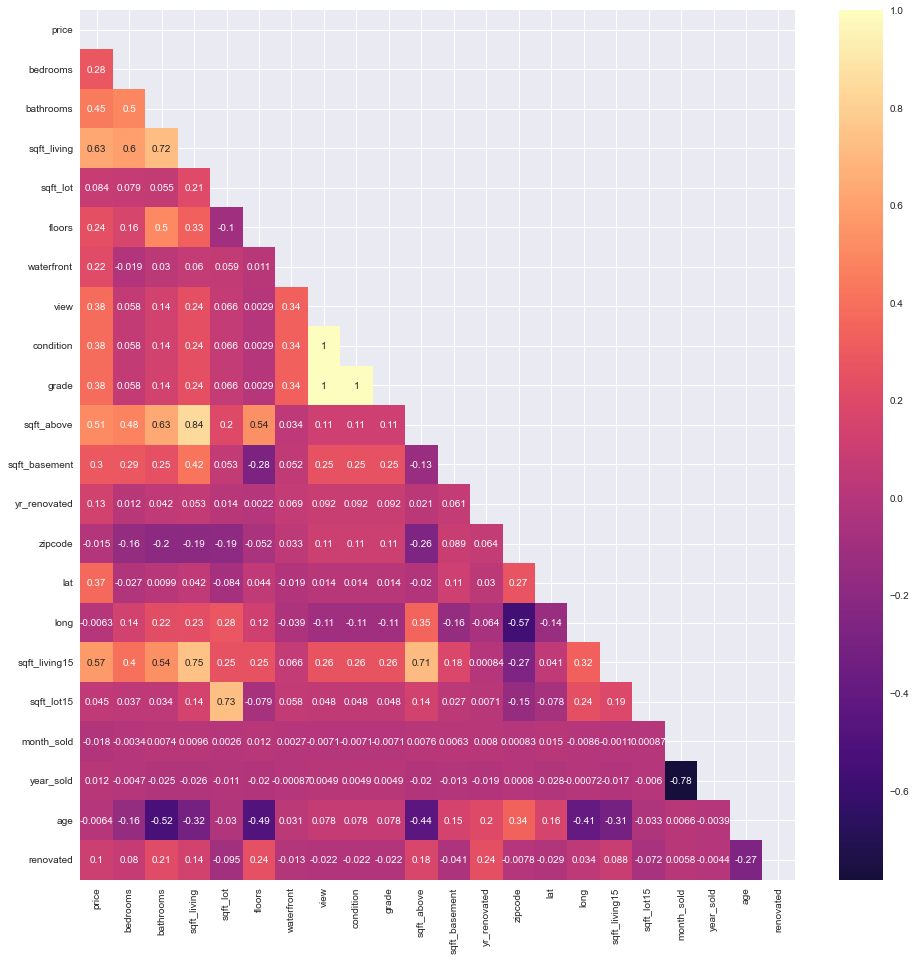
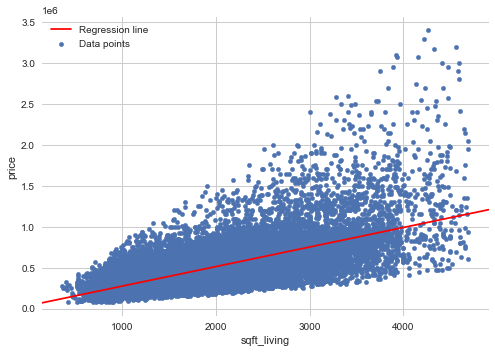
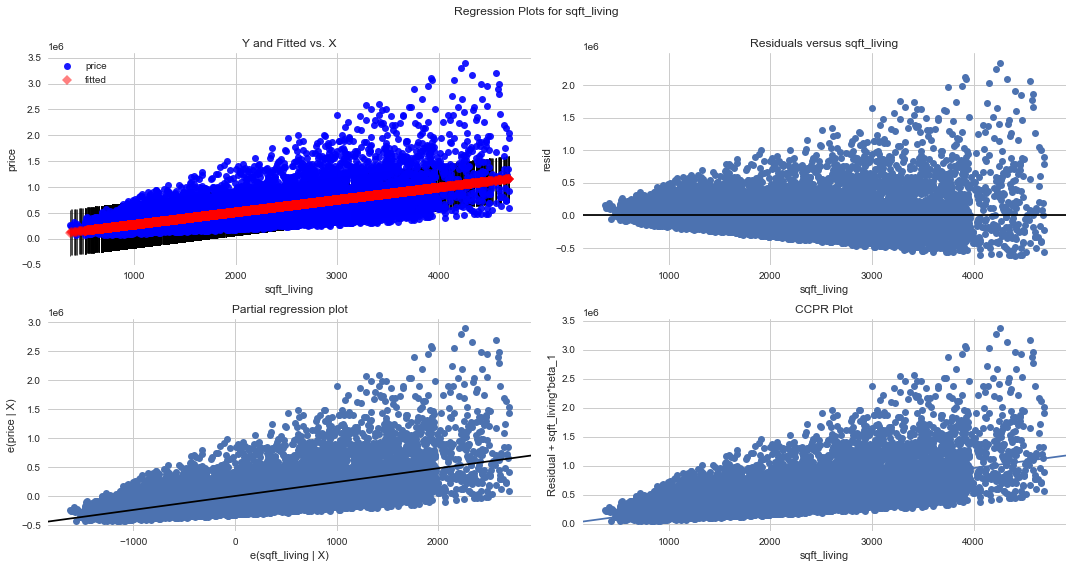
There appears to be a fairly clear linear relationship between the Square footage of living space feature and price of a home in King County. We can use this to make a baseline model.
Looking at our summary above, our regression line is 𝑃𝑟𝑖𝑐𝑒= 35,826 + 238 * sqft_living
We can make the following observations from the results:
- The model is statistically significant with a p-value below 0.05.
- The model explains 40.1% of the variance in price, as indicated by the adjusted R-squared value.
- Both the intercept (const) and the slope (sqft_living) coefficients are statistically significant with t-statistic p- values well below 0.05.
- For a house with a living space of 1000 square feet, we would expect the price to be about $273,826.
- Generally speaking, as the living space of the house increases, so does the price of the house.
Sales of properties is highest in spring and lowest in winter. Property developers such as our client Kings Wajenzi developers should target to develop properties that will be market in the season of spring and Summer.
Location within King County is also a crucial factor, with significant price disparities among zip codes. The location with zip code 98112 has the most priced properties with 98001 having the least priced properties. We suggest that developers targeting high end clients should develop homes in zip codes 98112 , 98109 and 98105. Those targeting low income earners should target to develop properties in zip codes 98001, 98106 and 98108. Those targeting middle income earners should target other zip codes.
The most important predictor of house price is view. We observed that house prices with waterfront view are the most desirable. Houses that have a waterfront view have median price that is almost twice as those that dont have waterfront view. We suggest that developers target to develop homes in front of water bodies such as lakes and rivers as these will fetch highest prices.
Number of bedrooms is the second most important predictor of house prices. Properties with higher number of bedrooms fetch high prices and hence developers should target high number of bedrooms where they wish to fetch high price for properties. However, incremeament beyond 6 bedrooms does not guarantee highest prices. The optimal number of bedrooms is 5 bedroom houses which fetch highest prices.
Number of bathrooms is not an important predictor of houses. Both high and medium priced properties have an optimal number of bathrooms which is 2.5. Low priced properties have 1 bathroom as the optimal. Therefore, developers should ensure high and medium priced properties have an optimum of 2.5 bathrooms.
The median house price increases with grade, suggesting a positive correlation. We believe that grade is a reliable indicator of price, so we recommend focusing on homes with a grade of 10 or higher.
Square footage and the condition of the property are also significant factors that affect the price of a house and should be considered by developers when developing their properties.
Our model had shortcomings initially as it only explained less than 50% but after improvements, it was able to predict almost 100% of variations in the response variable. This is because of proper data understanding, cleanup and fine tuning it. However, to gain new insights, we can consider additional factors such proximity to the capital city of Washington State, the income per zip code, presence of schools, hotels, commuter trains, and entertainment facilities. Longer time span should also be considered as the data used here was for 1 year only.
##For More Information See the full analysis in the Jupyter Notebook or review this presentation