This repo contains Sync Computing tools used to feed the required information into the Sync Autotuner for Apache Spark.
get_cluster_config.sh parses results of AWS CLI 'describe-cluster' and 'list-instances' command into a format accepted by our Prediction UI.
The script relies on AWS CLI to retreive the data.
AWS CLI installation instructions
./get_cluster_config.sh -i <cluster-id> -r <region>./get_cluster_config.sh -i j-3WBO3J7R6PVS -r us-east-1{"cluster": { "ID": "j-3M0WNYKET5TIV", "Timeline": { "CreationDateTime": 1639990568.943, "ReadyDateTime": 1639991128.293, "EndDateTime": 1640004773.038 }, "AvailabilityZone": "us-east-1d", "InstanceCollectionType": "INSTANCE_GROUP", "InstanceGroups": [ { "InstanceGroupType": "MASTER", "Market": "ON_DEMAND", "InstanceType": "m5.xlarge", "RequestedInstanceCount": 1, "VolumeSpecification": [ { "SizeInGB": 32 }, { "SizeInGB": 32 } ] }, { "InstanceGroupType": "CORE", "Market": "SPOT", "InstanceType": "m5.4xlarge", "RequestedInstanceCount": 4, "VolumeSpecification": [ { "SizeInGB": 20 } ] } ] }, "region": "us-east-1"}<cluster id> is the cluster id that you are interested in parsing. The cluster id is prefixed with 'j-'.
<region> represents the region the cluster ran in.
| New EMR console | Old EMR Console |
|---|---|
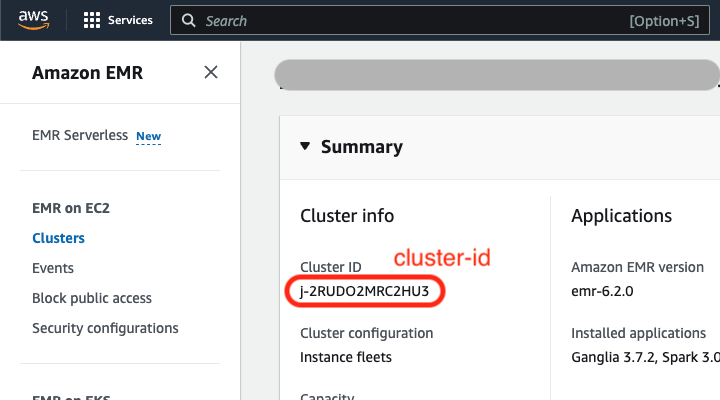 |
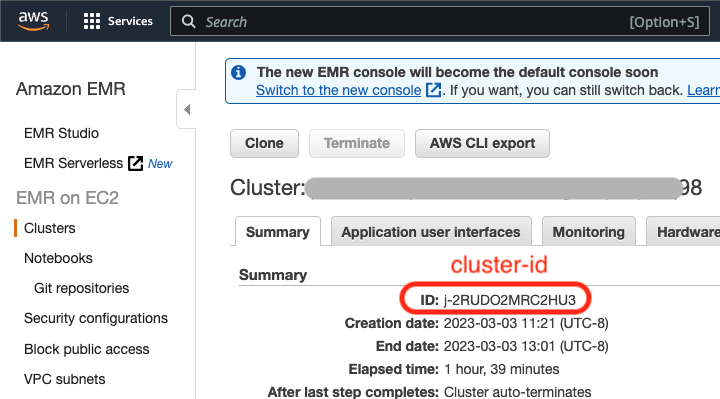 |
-
Go to the EMR console in AWS, and find the cluster that ran the job you are interested in optimizing. Click on the cluster name to view details of the cluster.
-
Verify that you have
spark.eventLog.enabledset to true for any jobs you are interested in optimizing. The Sync Autotuner needs a Spark event log from a job run in order to provide optimized cluster configurations for the job.
| New EMR console | Old EMR Console |
|---|---|
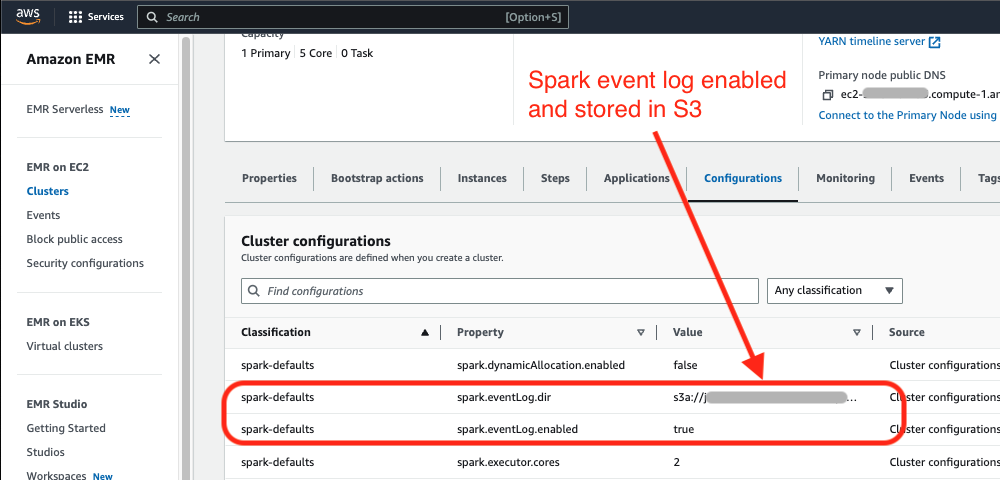 |
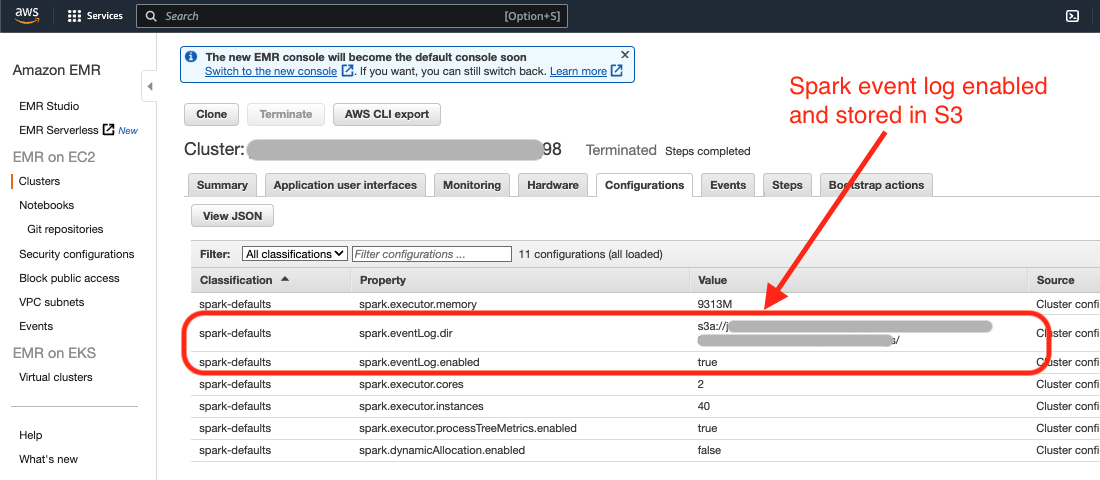 |
-
If
spark.eventLog.diris set and specifies an S3 location then download the Spark event log from the specified S3 location. Skip to Step 7. -
If
spark.eventLog.diris not set, follow the steps below to download the Spark event log from the Spark history server. -
Once you are in the cluster information page, click on the “Application user interfaces” tab, and click on “Spark history server” (in red below) under “Persistent application user interfaces.”
| New EMR console | Old EMR Console |
|---|---|
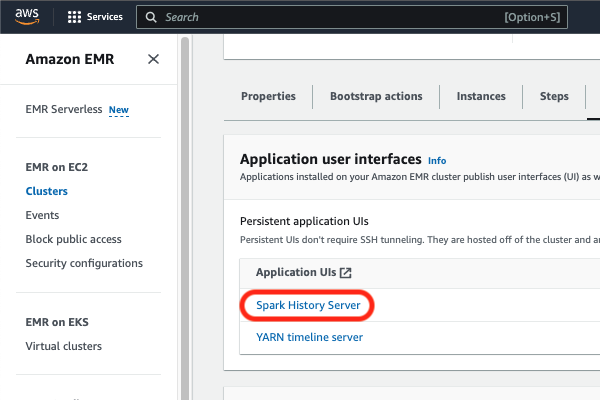 |
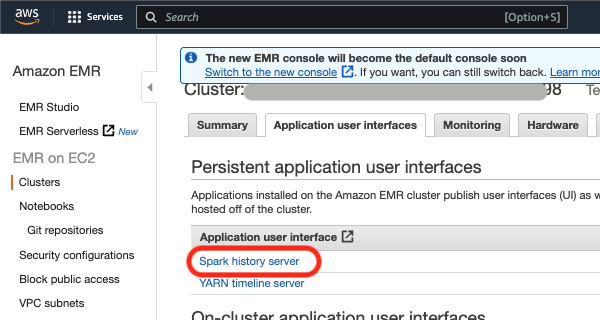 |
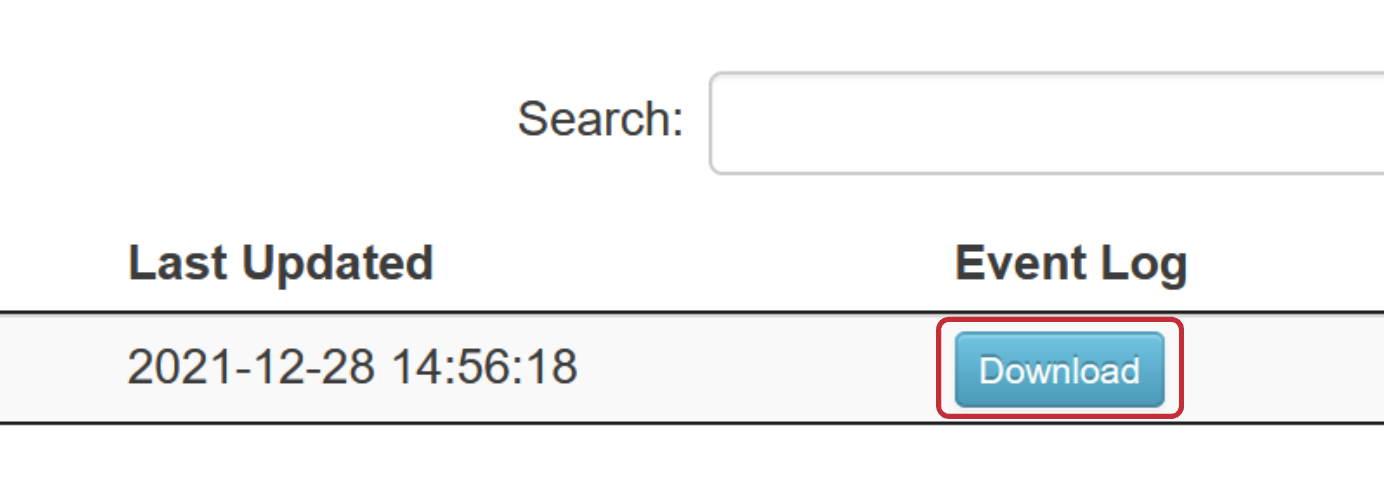
- A new tab should open up with the Spark history server. It may take a minute to load. Click the download button under the event log column to download the Spark event log.
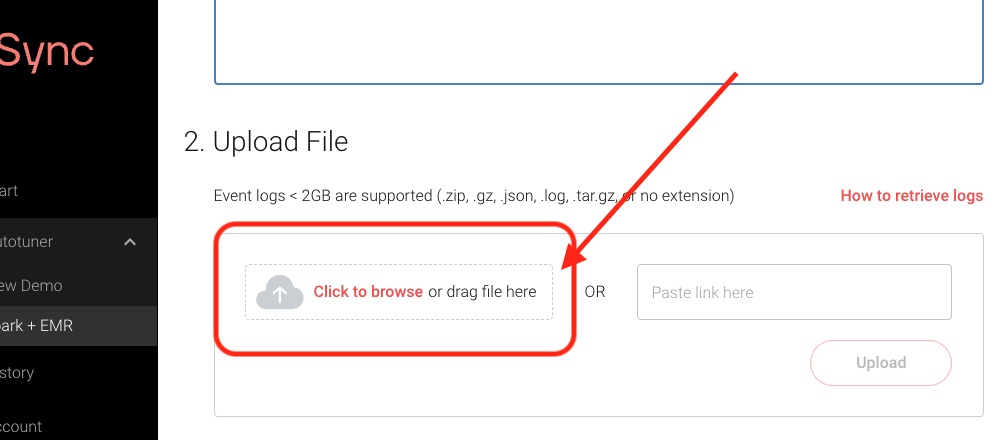
- Upload the Spark event log into the Autotuner.
These tools are not currently necessary to run the Autotuner for Databricks eventlogs.
get_databrick_cluster_eventlog.sh makes the appropriate Databricks CLI calls and combines the data into a single output file.
The script relies on Databricks CLI to retrieve the cluster events
Databricks CLI Installation instructions
./get_databricks_cluster_eventlog.sh -i <cluster-id> [-r <results directory>]./get_databricks_cluster_eventlog.sh -i 2631-121255-j612dkia -r /path/to/resultsIf the -r flag is excluded, then a new directory databricks_cluster_eventlogs will be created in the same directory as this script and results will be saved there.
Instructions for finding a cluster-id through the Databricks console can be found here. Alternatively, the cluster-id associated with a given Databricks Spark eventlog can be found opening the eventlog in a text editor and searching for the string spark.databricks.clusterUsageTags.clusterId.
{
  "events": [
    {
      "cluster_id": "2631-121255-j612dkia",
      "timestamp": 1659615195995,
      "type": "CREATING",
      "details": {
        "cluster_size": {
          "autoscale": {
            "min_workers": 2,
            "max_workers": 8
          }
        },
        "user": "user@company.com",
        "job_run_name": "job-1234567-run-1000"
      }
    },
    ...,
    {
      "cluster_id": "2631-121255-j612dkia",
      "timestamp": 1659616529106,
      "type": "TERMINATING",
      "details": {
        "reason": {
          "code": "JOB_FINISHED",
          "type": "SUCCESS"
        }
      }
    }
  ],
  "total_count": 22
}