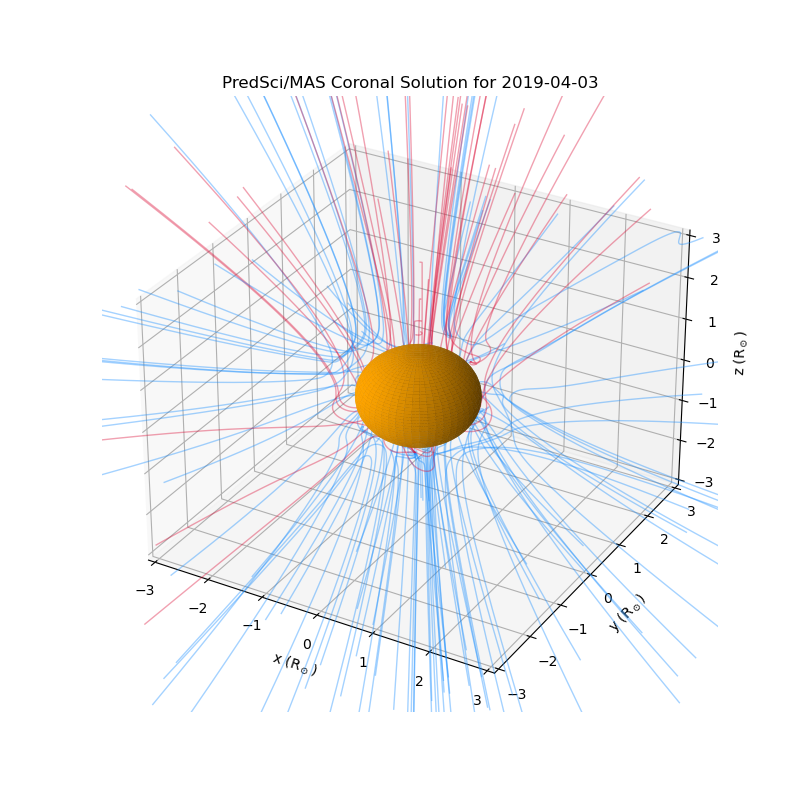
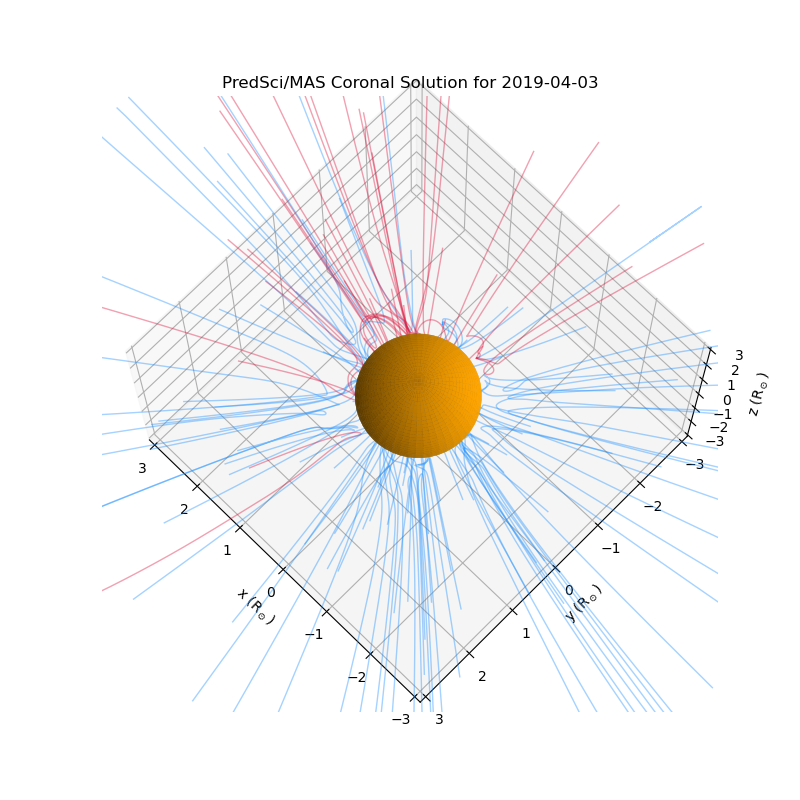
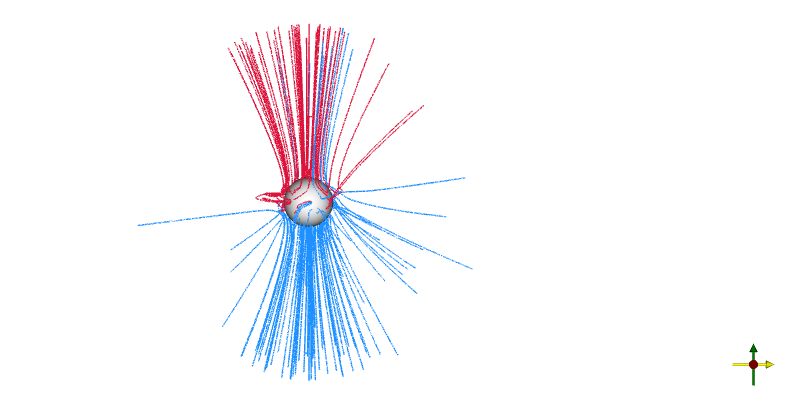
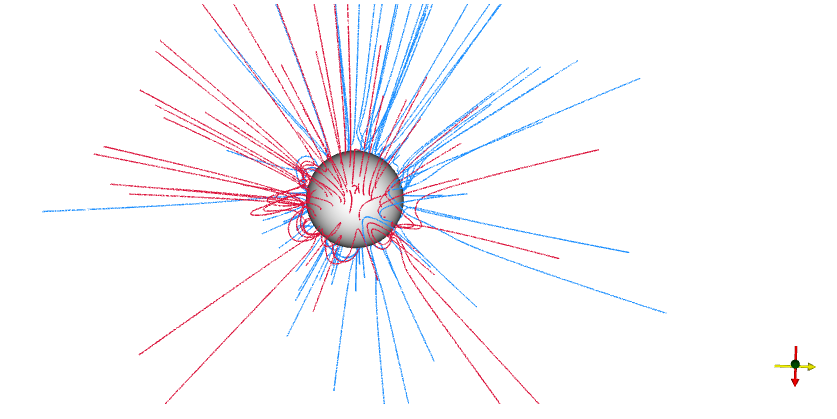
I found that the field lines of the coronal solution for that day April 3, 2019, seem to be like weird hyperbola shapes in matplotlib. Since matplotlib doesn't show the footpoints of the field lines on the Sun, I tried to plot with pyvista but it seems to be very slow, and also the field lines look collimated around the polar axis of the Sun. Also in pyvista, the axes aren't shown although it's written in the code to show them.
Is there a way to fix the field lines?
Also is there a way to show the closed field lines in black, as in the pfsspy?
Here is the matplotlib code
mas_output = MASOutput(directory) # location of the predsci/MAS files
br = mas_output['br']

# Do the tracing
nseeds = 12
rad_extend = 1.5
r = np.ones(nseeds**2)*rad_extend*u.R_sun
lat = np.linspace(-89, 89, nseeds**2, endpoint=False)*u.deg
lon = np.random.rand(nseeds**2)*360*u.deg

max_steps = 10000
step_size = 1
tracer = FortranTracer(max_steps=max_steps, step_size=step_size)
flines = tracer.trace(mas_output, r=r, lat=lat, lon=lon)

fig = plt.figure(figsize=(8,8)) # figsize=(10,10) # figsize=plt.figaspect(1)
ax = plt.subplot(111, projection='3d')

# draw the Sun
solrad = 1
usph, vsph = np.mgrid[0:2*np.pi:50j, 0:np.pi:50j]
xsph = np.cos(usph)*np.sin(vsph)*solrad
ysph = np.sin(usph)*np.sin(vsph)*solrad
zsph = np.cos(vsph)*solrad
ax.plot_surface(xsph, ysph, zsph, color='orange', alpha=1)

# draw the field lines
idx = 0
for fline in flines:
    color = (br.sample_at_coords(np.mod(fline.lon[idx], 2*np.pi*u.rad), fline.lat[idx], fline.r[idx]*u.R_sun) > 0)
    color = {1: 'crimson', 0: 'dodgerblue'}[int(color)]
    ax.plot3D(fline.xyz[:,0], fline.xyz[:,1], fline.xyz[:,2], color=color, linewidth=1, alpha=0.4)
ax.set_title('PredSci/MAS Coronal Solution for 2019-04-03')
lim = 3
ax.set_xlim(-lim, lim)
ax.set_ylim(-lim, lim)
ax.set_zlim(-lim, lim)
for axis in 'xyz':
    getattr(ax, 'set_{}label'.format(axis))(axis+' (R$_\odot)$')
plt.show()
Here is the pyvista code in jupyter notebook
mas_output = MASOutput(directory)
br = mas_output['br']

plotter = MASPlotter(mas_output)
nseeds = 12
start_seed = 1.2
r = np.ones(nseeds**2)*start_seed*u.R_sun
lat = np.linspace(-89, 89, nseeds**2, endpoint=False)*u.deg
lon = np.random.rand(nseeds**2)*360*u.deg

# Do the tracing
max_steps = 10000
step_size = 1
tracer = FortranTracer(max_steps=max_steps, step_size=step_size)
flines = tracer.trace(mas_output, r=r, lat=lat, lon=lon)

for fline in flines:
    # Set color with polarity near the inner boundary
    color = (br.sample_at_coords(np.mod(fline.lon[0], 2*np.pi*u.rad), fline.lat[0], fline.r[0]*u.R_sun) > 0)
    color = {1: 'crimson', 0: 'dodgerblue'}[int(color)]
    plotter.add_fline(fline, color=color)

# Add a sphere at the inner boundary of the model
plotter.add_sphere(1*u.R_sun)
plotter.pvplotter.add_axes(x_color='black', y_color='black', z_color='black')
plotter.pvplotter.background_color = 'white'
plotter.show(window_size=[400,400], cpos='yz', jupyter_backend='panel')
Here are the plots from matplotlib and pyvista. Both are done with tracer = FortranTracer(max_steps=10000, step_size=1)
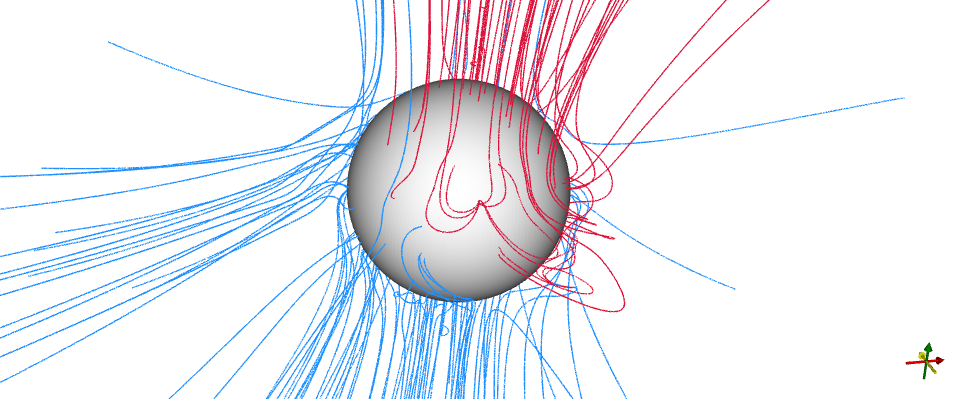
I found that the field lines of the coronal solution for that day April 3, 2019, seem to be like weird hyperbola shapes in matplotlib. Since matplotlib doesn't show the footpoints of the field lines on the Sun, I tried to plot with pyvista but it seems to be very slow, and also the field lines look collimated around the polar axis of the Sun. Also in pyvista, the axes aren't shown although it's written in the code to show them.
Is there a way to fix the field lines?
Also is there a way to show the closed field lines in black, as in the pfsspy?
Here is the matplotlib code
Here is the pyvista code in jupyter notebook
Here are the plots from matplotlib and pyvista. Both are done with
tracer = FortranTracer(max_steps=10000, step_size=1)